Worldwide Electronics Warranties:
It's not where you're from as much as what you make. European and Japanese electronics companies report warranty expense rates similar to what their American competitors do. The difference is that while U.S. companies must report what used to be trade secrets, the international companies are simply doing their New York Stock Exchange shareholders a big favour.
Last week's traditional Fourth of July look at European and Asian warranty providers was met by an elevated level of interest by our non-American readers. To be sure, we received 1,718 "out of office" notifications (more than a third of the subscriber base), making our email administrator wonder if we were under some kind of cyber attack by the North Koreans.
But there also were a good many comments and questions coming from countries where the fourth is just another day of the month. Many wanted to know why such-and-such a company was not included, and the simple answer is that only a few dozen non-American companies disclose their warranty expenses at the level of detail needed to create the charts that you see in this week's and last week's newsletters. If it existed, we'd print it.
One reader offered his services as a potential translator, which we gladly accepted, assuming there's warranty data in the financial statements of French, German, and Italian manufacturers. Another wanted to know what warranty disclosures were required of non-American manufacturers by non-American financial regulators. The simple answer is: none. As in pre-2003 America, warranty spending rates and totals are top-secret metrics.
Thank goodness for the Enron scandal! If not for their alleged cover-up of the costly guarantees they had made, the Financial Accounting Standards Board might never have required American companies to disclose their warranty expenses, beginning in 2003. And if American companies had never been required to, some of the European and Japanese manufacturers who sell stock in New York might never have followed suit.
Last week we covered some of the top vehicle makers, who dominate a category that accounts for perhaps 53% of the US$72 billion worldwide warranty spend. This week, we propose to spotlight some of the top telecom, computer, and electronics companies that along with their American counterparts account for an additional 20% or so of the worldwide pie.
Typical Spending Levels Worldwide
As we did last week, we're using ¥98.2 = US$1.00 = €1.39 as our exchange rates, although currencies are not as important in these metrics as is the percentage of sales that warranty expenses consume. And no translator is needed to suggest that warranty expense rates under 1% of sales are low, while anything over 5% is high. Anything close to 10% is catastrophic. In telecom, appliances, computers and autos, anything in the 2% to 3% range is typical. But in industries such as medical equipment, auto parts, semiconductors and many consumer electronics sectors, even 2% is too high.
The claims and accrual rates are percentages derived from warranty amounts divided by product sales. In the past nine months, many companies have reported rapidly falling sales totals, which has caused their claims rates to spike, because they're essentially repairing last year's units with this year's reduced revenue. But it shouldn't have a major effect on accrual rates.
And then there are the lucky few companies that are in markets that are so hot that they're almost recession-proof. For instance, Nokia's product sales were down slightly in the year ended Dec. 31, 2008, to €50.71 billion, from €51.06 billion the year before. That's a 0.7% decline -- barely noticeable compared to the carnage that the automakers are reporting. However, both claims and accruals were up. Nokia's claims rose from €963 million in calendar 2007 to €1,070 million in calendar 2008, while accruals grew from €1,127 million to €1,211 million in the same period.
As a result, Nokia's claims rate rose from 1.9% in calendar 2007 to 2.1% in calendar 2008, while its accrual rate rose from 2.2% to 2.4%. Both of those rate increases can be seen in Figure 1 below.
Figure 1
Nokia Corp.
Warranty Claims & Accrual Rates, 2003-2008
(as a percentage of product sales)

Claims and accrual rates have remained inside a very narrow band for all of the past six years. However, readers will note a gradual rise in warranty outlays, represented by the blue bars, for each of the past four years. But because sales rose more or less proportionally, the claims and accrual rates, as represented by the red and green lines, remained more or less the same.
We should note that most of the data in this week's charts is derived from annual reports, which we have taken the liberty of dividing into four equal fourths to fit into the quarterly reporting format used by most American manufacturers. In other words, the €1,070 million annual figure for Nokia's claims has been chopped into four quarters of €268 million each in Figure 1.
Accounting Differences
Also, the fiscal years of Nokia, Alcatel-Lucent, Canon, and Ericsson ended on December 31. Siemens ended its fiscal year on September 30, 2008. Sony, Panasonic, and Hitachi ended their fiscal years on March 31, 2009. Therefore, four of the charts contain data for 24 quarters, three are for 25 quarters, and one is for 23 quarters.
This week, we're dealing with the accounting systems of five countries and three different currencies. Nokia is Finnish. Siemens is German. Alcatel-Lucent is French. All three use the euro. Ericsson is Swedish and uses the kronor in its financial reports. Sony, Panasonic, Hitachi, and Canon are Japanese and report their financials in yen.
The currency differences cancel out of the percentage rate calculations, of course. It doesn't matter if we're using euro, yen, or kronor. When we say a given company spent 2% of its revenue on warranty claims, we mean 2% of whatever currency is in use. It's up to the multinational companies themselves to make the conversions from dollars, pesos, pounds and roubles, for both their consolidated revenue totals and their warranty costs.
We're not sure if the national accounting systems have different definitions of product revenue and warranty claims. But whatever the respective definitions are, we assume they are constant over time. So the total listed for warranty claims in 2003 for a given company should be comparable to what that same company lists for 2008, even if it is not comparable to another company's figures. And the percentages we calculate using warranty claims, accrual, and revenue should be comparable over time -- at least when comparing a given company to itself.
That's a very important point, so let's say it again in a different way. While we can't compare companies across national boundaries or between currencies, we can compare a company to itself over time. So while it's useful to look at the charts to see the percentage level at which a company is paying claims, what is more revealing is the six-year trend. Companies may moan about the effects of new product introductions, dollar devaluations, swine flu, sunspots, and recessions, but the six-year trend pretty quickly reveals whether their grasp and control of warranty costs is increasing, decreasing, or has yet to manifest itself.
Steadfast Siemens
Siemens is one of only two companies in this week's roundup to see its sales increase in its most recent fiscal year. But that's only because its fiscal year ended on September 30, a mere two weeks after the Panic of '08 began. Siemens was also lucky to see both its claims and accrual totals fall, both in terms of euros and as a percentage of sales.
Product sales rose from €71.55 billion to €75.67 billion. Warranty claims fell from €888 million to €651 million. Accruals fell from €1,470 million to €1,329 million. The claims rate slipped from 1.2% to 0.9%. And the accrual rate fell from 2.1% to 1.8%.
Figure 2
Siemens AG
Warranty Claims & Accrual Rates, 2003-2008
(as a percentage of product sales)
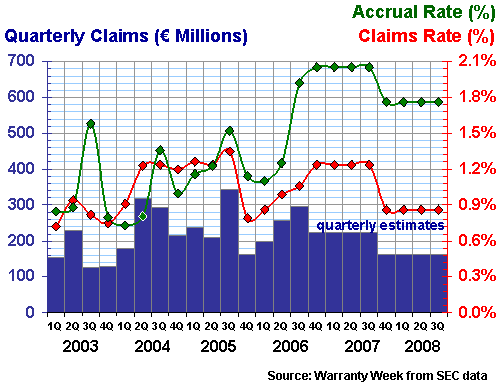
The reason why Siemens' 2007 and 2008 data seems more stable than its 2003-2006 data is simple: the company switched from quarterly disclosures to annual disclosures at the end of 2006. We can infer that there was just as much volatility in the past two years, but without supporting data all we can draw are flat, smooth lines. And there is perhaps no better demonstration of why management might prefer less-frequent disclosures while customers and shareholders might prefer more-frequent warranty expense reports.
Taking Out Movies and Music
For Sony, we had to first subtract a significant amount of entertainment revenue from the totals, so as to prevent us from trying to calculate the warranty cost of a feature film or a Billy Joel album. However, because the company reports only consolidated warranty figures, our calculations are an average of the costs seen in the computer, television, camera, audio, and gaming product lines.
In the year ended March 31, 2009, Sony saw warranted product sales fall 16%, from ¥7.15 trillion to ¥6.02 trillion. Claims and accruals also fell, but not as fast. Claims declined from ¥54.5 billion to ¥58.4 billion. Accruals declined from ¥66.7 billion to ¥60.8 billion in the most recent year. But the rates rose, from 0.8% to 0.9% for claims and from 0.9% to 1.0% for accruals.
Figure 3
Sony Corp.
Warranty Claims & Accrual Rates, 2003-2008
(as a percentage of product sales)
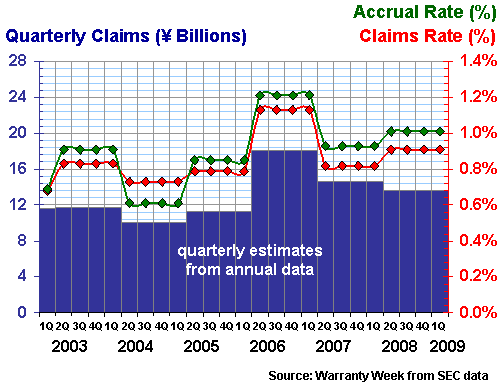
Unlike the auto industry, in this week's roundup the range of the claims and accrual rates seems to have more to do with the industry a given company is in than it does with the location of its headquarters. As can be seen in Figure 3, it is possible for a Japanese company to spend as much as the Europeans (and Americans) do on warranty. Why? We suspect it has lots to do with Sony's stake in the computer industry, where high claims rates are common. Take away the computers, and you're left with Panasonic.
Speaking of which, Panasonic saw sales fall 14% in its most recent fiscal year, but both warranty claims and accruals rose. Sales came in at ¥7.77 trillion, while claims were ¥45.8 billion and accruals were ¥51.5 billion. In the previous fiscal year, sales were ¥9.07 trillion, while claims were ¥37.0 billion and accruals were ¥42.2 billion. Therefore, the claims rate rose from 0.4% to 0.6%, while the accrual rate rose from 0.5% to 0.7%.
Figure 4
Panasonic Corp.
Warranty Claims & Accrual Rates, 2003-2008
(as a percentage of product sales)

Panasonic also has a stake in the computer industry, primarily through its Toughbook line of ruggedized notebooks, which must generate some significant warranty costs thanks to three-year warranties. But it would be a major contradiction if that line of business represented a major portion of Panasonic's warranty costs, wouldn't it? I mean, they're supposed to be tough.
Panasonic is also engaged in the sale of home fire alarms, semiconductors, auto navigation systems, and men's shavers. And they do sell professional and business equipment. But it would not be unfair to call them primarily a consumer audio, video, computer and communications company, with the emphasis on consumer. As such, the 0.4% to 0.7% range seen in Figure 4 is probably a benchmark for consumer electronics. That's the mark to measure yourself against.
We should note that until October 2008 the company's official corporate name was Matsushita Electric Industrial Company Ltd. and Panasonic was merely a brand. Then it changed the name. The company really is quite diverse within the brown and white goods industries, but as Figure 4 shows, it has the relatively low warranty cost pattern that is typical of a consumer electronics company. Telecom equipment and computers are warranty-intensive. Audio and video equipment is not.
Telecom Equipment Leaders
Speaking of which, Alcatel-Lucent is a premier telecom equipment supplier not only on the continents of its hyphenated merger partners, but also worldwide. While it has interests in the mobile and wireless segments, its pain et beurre is in carrier equipment.
Despite or perhaps because of the self-destruction of arch-rival Nortel, Alcatel-Lucent saw a 7.4% sales decline in calendar 2008. But its warranty costs fell even faster. Sales fell from €14.6 billion to €13.5 billion, but warranty claims fell from €370 million to €292 million and accruals fell from €500 million to €354 million. That resulted in a year-ending claims rate of 2.2% and a year-ending accrual rate of 2.6%.
Figure 5
Alcatel-Lucent
Warranty Claims & Accrual Rates, 2003-2008
(as a percentage of product sales)

When Lucent was a distinct company, it managed to reduce its warranty costs by incredible amounts. Back in 2003 its warranty costs exceeded 3.6% of sales. By 2004 that had been cut to 1%. And then by the time of the merger in late 2006 it had risen back to only 1.9% -- somewhat lower than where it's been for the past two years. We should note that while Alcatel filed its warranty disclosures every six months and Lucent filed them every three months, the merged companies now report only annually.
Place-Saving Estimates
Hitachi also usually reports its warranty expenses every six months, which is why most of the data points in Figure 6 come in pairs. As this issue of Warranty Week goes to press, the most recent six months of data is still not available, though it was anticipated to be filed in June. So we have repeated last year's data as a place-saving estimate, and we will forego any annual comparisons. The less preferable choices were to either leave the columns blank or chop off the chart after the third quarter of 2008.
However, we didn't want to end the company's story with last summer's report, because Hitachi also managed to slip in an intriguing quarterly report covering the third calendar quarter of 2008. That's why there's a pronounced dip in the time series below for that period of time. Claims fell to 0.3%, while accruals fell to only 0.13%. Both were the lowest percentages reported by the company since at least 2003. Was that quarter an anomaly or the beginning of a new trend? Suffice it to say that it will be very interesting to see what happens in the next few weeks when the data for the second half of the most recent fiscal year finally becomes available.
Figure 6
Hitachi Ltd.
Warranty Claims & Accrual Rates, 2003-2008
(as a percentage of product sales)
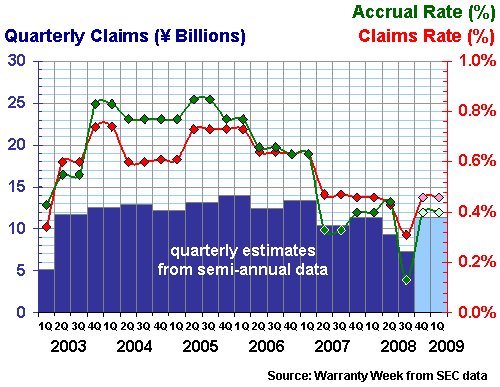
The data in Figure 6 supports a statement that Hitachi has found a way to consistently reduce its warranty costs over time. Of the eight companies profiled here, we'd say that about only Hitachi and Ericsson. Nokia, Panasonic and Sony have perfected the ability to remain consistent, but based on six years of data, we'd have to say that Hitachi and Ericsson have learned how to cut.
Different Fiscal Years
Canon is of course a Japanese company, so it reports in yen. But unlike its peers Sony, Panasonic, and Hitachi, Canon ends its fiscal year on December 31. In that fiscal year, sales fell 8.6% while yen-denominated warranty expenses were virtually unchanged. But because the claims and accrual rates are calculated by dividing sales into claims and accruals, both rates rose. The claims rate increased from 0.58% to 0.66%, while the accrual rate rose from 0.69% to 0.75% (we don't want to exaggerate the accuracy, but one digit past the decimal point would have rounded off too much).
Figure 7
Canon Inc.
Warranty Claims & Accrual Rates, 2003-2008
(as a percentage of product sales)
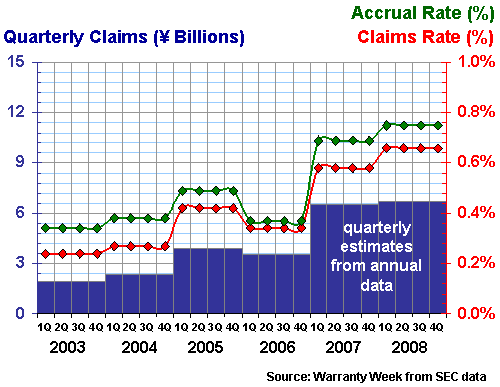
Were it not for the anomaly of 2006, one could see a clear pattern in the Figure 7 data suggesting a gradually rising warranty cost profile. Yes, the rates are still far below 1%, but they've each more than doubled since 2003. And both Canon's claims and accrual rates are now at their highest-ever levels, at least since reporting began in 2003. There's no danger signal flashing here, but there's also no boasting to be done.
Speaking of which, Ericsson is the only other company in this week's roundup to be able to boast of a sales increase in its most recent annual report. Sales rose from 187.8 billion Swedish kronor to 208.9 billion Swedish kronor (1.00 USD = 6.08 SEK) in the year ended Dec. 31. At the same time, warranty claims fell precipitously, while accruals rose more or less in proportion to sales. A round of akavit, or Absolut, or whatever it is they drink in Sweden when they're happy, is in order.
Lag Time with Claims Paid
This might also be a good time to bring up a point raised by another reader last week. In looking at auto claims and accrual rates, he asked whether we were making allowances for the lag time between when a vehicle is sold and when it is repaired under warranty. We said we were not. So in a radical sales downturn as is now the reality, we were essentially comparing vehicles sold in 2006 and 2007 with revenue earned in 2008.
That, he said, creates a false picture of true costs. It would be better, he suggested, if we averaged three years of revenue and three years of warranty claims to get a moving average of the warranty claims rate.
The problem is, there are still national markets where 12-month warranties prevail. And then there are the extra-long Kia and Hyundai warranties in select markets, not to mention the four-year norm in the luxury market and the five-year and even lifetime powertrain warranties in some markets. In addition, 18% of Honda's revenue comes from motorcycles and generators. The bottom line is that even with detailed market-by-market and product-by-product unit data, the process of time-shifting and/or averaging revenue and claims costs would take us too far into the theoretical realm, away from the hard math.
Fortunately, the accrual rate suffers no time lag. What a company accrues in 2009 is what it believes its 2009 sales will cost it over the long run. When the accrual rate changes, it should signal a change in product quality or repair cost, or perhaps a change in the price per unit. It should not go up or down simply because a company needs to boost or reduce its earnings to "make its numbers." Even though it's an estimate based upon a projection, it should not be manipulated arbitrarily.
For instance, it should not be raised or lowered to compensate for past over- or under-accruals. It should simply reflect the expected future warranty cost of current sales, and that amount should be set aside as those sales are made, unit by unit. So if the accrual is set at €10 per unit, and 500 units are sold this week, €5,000 should be set aside this week to finance future warranty claims. If sales rise to 600 units next week, €6,000 should be set aside in accruals. Assuming the price per unit stays the same, so should the accrual rate, even though unit sales are increasing.
In other words, what Ericsson did was exactly as it should be. The accrual rate remained close to 0.8% in both 2007 and 2008 because that is the cost the company predicted for future warranty work. The accrual rate fell in each of the preceding three years because the claims rate was expected to fall too. And lo and behold, it did -- perhaps not in lock-step with accruals, but over time the claims rate fell from 2.6% in 2003 to 2.0% in 2006 and 0.6% in 2008. Time proves the estimates right or wrong.
Figure 8
Ericsson LM Telephone Co.
Warranty Claims & Accrual Rates, 2003-2008
(as a percentage of product sales)

With this week's eight electronics warranty snapshots and last week's six vehicle warranty snapshots, we've now profiled 14 different European and Asian manufacturers in more or less the same format as is done with the American companies that are required to follow the FASB Interpretation No. 45 accounting rules on warranty disclosures. This week's telecom, computer and consumer electronics companies are part of the "high-tech" slice of the pie, which we believe accounts for roughly 20% of the US$72 billion worldwide warranty pie.
Along with American-based companies such as Hewlett-Packard, Dell, IBM, Motorola, Cisco and Apple, these eight are among the top brands in that space. And while we wish there was more publicly-available warranty data from the likes of Lenovo, Samsung, LG, Acer, Sharp, Toshiba, or Nintendo, what we have gives us a representative sampling of that 20%.


