


Appliance & Building Material Warranties:
We conclude our mid-year product warranty report with a look at the supplier side of the homebuilding industry, where we find at least one group paying more for warranty claims this year than they did last year.
Evidence of an economic recovery can turn up in the most unlikely of places. Four weeks ago, in the Sept. 24 newsletter, we suggested that an upturn in the amount of warranty claims paid by new home builders could signal that a bottom had at long last been reached in that sector. This week, we're going to do better, and suggest that some of those homebuilders' suppliers are actually paying out a record amount for warranty claims right now, in 2009.
Sales are down, no mistake about it. Construction remains at a low point. But building activity, or at least the repairs and warranty work that results from building activity, is by our measurement at an all-time high. Chalk it up to labor rate increases, commodity inflation, Chinese drywall problems, currency exchange rate chaos, product quality declines, sunspots, hurricanes, or stimulus spending, if you must. But the fact remains that this select group of warranty providers paid out more in claims this spring than they ever have before.
In the chart below, we've included figures for two industry sectors: 1) HVAC and Appliances, and 2) Fixtures, Furniture and Building Materials. Of the 14 industry sectors we track, the fixtures, furniture and building materials sector has shown the largest dollar increase in claims paid during the first half of 2009. Claims are up almost 7% from a $377 million total in the first half of 2008.
Handful of Annual Increases
The only other sectors to show any increases in claims paid so far this year were auto parts suppliers (+5%), aerospace manufacturers (+4%), and medical and scientific equipment providers (+2%). The other ten sectors saw their claims totals contract, primarily because of falling sales, but also because of missing companies (GM, Fleetwood, Monaco, MPC, etc.).
The HVAC and appliance sector saw claims fall by 8%, from $935 million in the first half of 2008 to $857 million in the first half of 2009. But when combined with the building materials sector, where claims have grown this year, the decline is less apparent, as can be seen in the chart below.
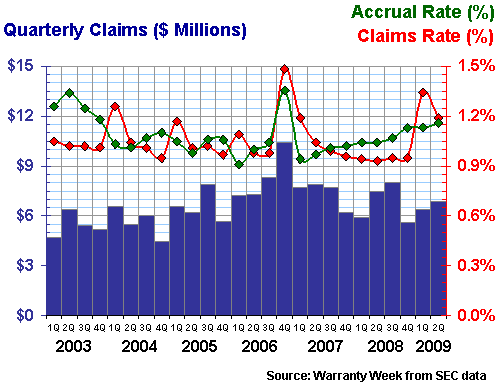
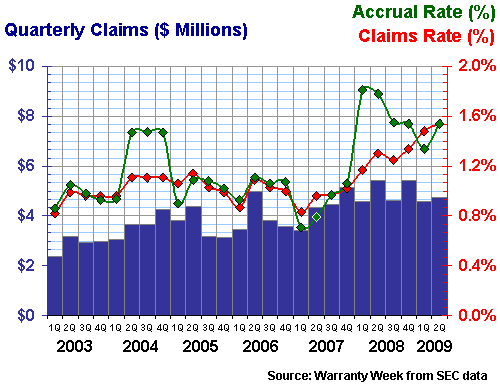
Figure 1
U.S.-based HVAC, Appliance, Fixture, Furniture & Building Material Manufacturers
Warranty Claims Paid per Quarter, 2003-2009
(in US$ millions)
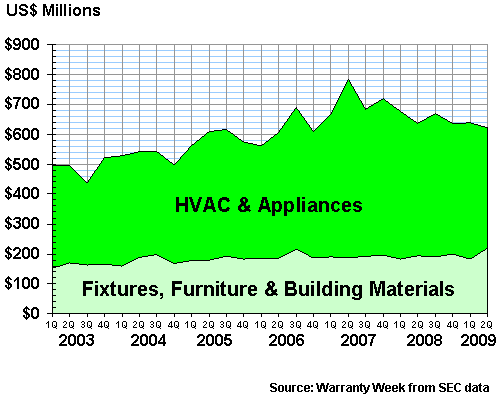
Warranty claims paid in the HVAC and appliance sector "peaked" at a rate just under $600 million in the second quarter of 2007. In the fourth quarter of 2007, manufacturers in that sector paid out $523 million to honor warranty claims. In no other year have HVAC and major appliance makers paid out more than $500 million in a single quarter.
In the building materials category, the April-to-June quarter of this year is the "peak" for warranty claims, with the third quarter of 2006 close behind. In no other quarter has this collection of furniture, fixture, and building material manufacturers ever paid out more than $200 million in warranty claims.
All 14 industry sectors saw their warranty accrual totals fall in the first half of 2009. But, if it means anything, the building materials sector fell the least, with its accrual total contracting from $392 million to $358 million. The declines for auto parts, aerospace, and medical equipment were each well over 10%. All these declines are closely tied to sales decreases. When a company sells less product, it sets aside less revenue for future warranty work.
As recession turns to recovery, both claims and accruals are going to increase, not only in dollar terms, but also as a percentage of revenue. In the building trades, it's typical for the warranty costs of both homebuilders and their suppliers to remain close to 1%, except in the case of major appliances, which seem to experience much higher warranty costs. In the nine examples to follow, we'll take a tour of both the high and the low ends of the supplier landscape, looking at everything from commercial ovens to kitchen cabinets to residential bedding.
Whirlpool Warranties
Let's start with the top U.S.-based maker of washers, refrigerators, and other major appliances. Whirlpool Corp. has usually kept its warranty costs between 2.5% and 3.8% of sales, except for one mid-year spike in 2007 and two end-of-year drops in 2004 and 2005. However, both Whirlpool's warranty claims and accrual rates were towards the low end of that range a year ago, and both have risen since, so the year-ago comparisons aren't all that great looking.
Sales fell 20% in the half-year, but claims fell only slightly, from $214 to $213 million. Therefore, the claims rate rose from 2.8% of estimated product revenue to 3.5% of revenue. The amounts set aside as warranty accruals also fell, but not as fast as sales, so the accrual rate also rose, from 2.6% to 3.0%.
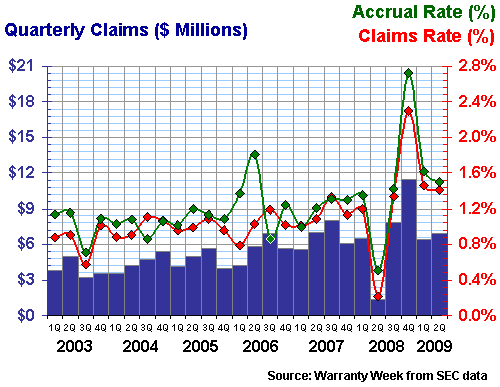
Figure 2
Whirlpool Corp.
Warranty Claims & Accrual Rates, 2003-2009
(as a percentage of product sales)
Not all of the percentage increases in warranty costs can be blamed on slow sales, however. As can be seen in the blue bars of Figure 2, Whirlpool paid out $119 million in claims during the second quarter of 2009 -- the highest amount reported by the appliance maker since 2007. Then again, claims reported for the final quarter of 2008 and the first quarter of 2009 were at the lowest levels seen since early 2006, so perhaps what we're seeing is nothing but a time-shift in payments?
Commercial Cooking Appliances
The Middleby Corp. is part of a completely different end of the appliance business. While Whirlpool and its Maytag acquisition sell primarily into the residential appliance sector, Middleby and its TurboChef acquisition sell their appliances to a primarily commercial customer base, such as the Dunkin Donuts and Subway fast food chains. Its Nu-Vu ovens can make bread in less than 15 minutes. Its Toastmaster units make everything from pizza to home fries. Its Wells/Bloomfield equipment is used to make everything from coffee and waffles to steaks and Big Macs.
In terms of warranty costs, Middleby had consistently reduced both its claims and accruals year after year, until 2009. As can be seen in Figure 3 below, the downward trend ended in 2008, and reversed direction this year. In the year since June 2008, the claims rate has jumped from 2.3% to 3.8%, while the accrual rate grew from 2.3% to 3.9%.
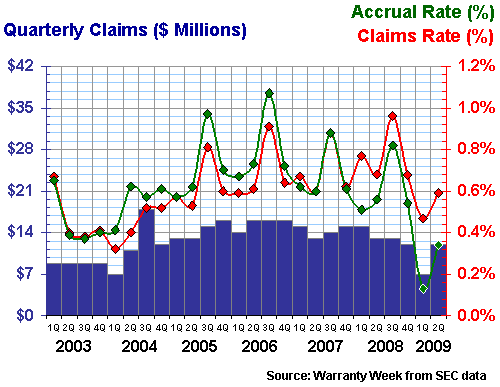
Figure 3
Middleby Corp.
Warranty Claims & Accrual Rates, 2003-2009
(as a percentage of product sales)
Middleby's sales were actually up by 2% during the first half of the year, so the sudden jump in warranty rates can't be explained away by the increasingly common misfortune of falling sales. No, in this case the rising rates are due to rising payments. Claims payments in the first half of 2009 rose to $13 million from $7.8 million in 2008. Accruals rose from $7.7 million to $13 million. So if anything, the sales rise took a little off the percentage increases.
Of the 96 companies we track in the HVAC, appliance, furniture and building material sectors, only seven registered sales increases in 2009, and five of those increases were in the single digits. Of those five, only Middleby and lighting fixture manufacturer AZZ Inc. saw claims and accrual rates rise despite the increasing sales. The other three saw sales rise and warranty percentages fall, as one would expect.
HVAC Sales Declines
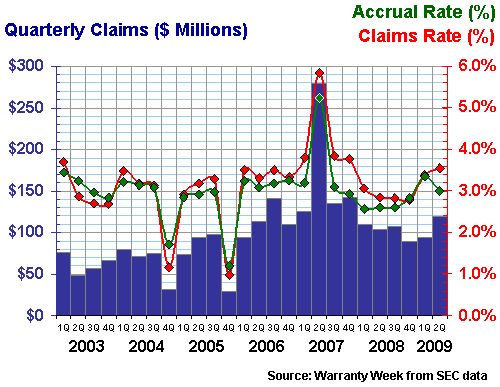
Sometimes it's a matter of falling the least, as with Goodman Global's 5% sales decline in the first half of 2009. As can be seen in Figure 4, Goodman's claims and accrual rates are up since a year ago. Sales fell from $953 million to $902 million, while claims rose from $21 million to $24 million, and accruals rose from $20 million to $21 million.
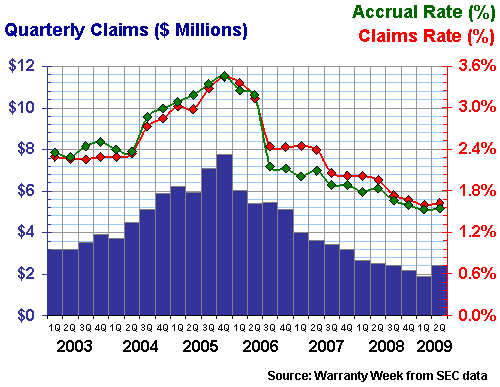
Figure 4
Goodman Global Inc.
Warranty Claims & Accrual Rates, 2003-2009
(as a percentage of product sales)
Of course, that leaves out the quarters in between, in which claims and accruals first soared and then plummeted in the third and fourth quarters of last year. Once again, we suspect the time-shifting of payments is to blame. Accelerate a few big claims to the summer and postpone a few reimbursements to the fall and that's exactly what happens: One quarter is twice as high as it should be and the next is virtually empty.
We should note that the reason the first few years of data in Figure 4 are so flat is because Goodman at the time wasn't a public company. When it finally did make its initial public offering of stock, some of the financial documents it released included annual warranty data going back several years. We took that data and divided it into four equal pieces, to make it fit into our quarterly format.
Are Industry Averages Meaningful?
A recent caller asked about HVAC industry averages for warranty costs. The problem, we said, is that three of the major players are now part of much bigger companies that don't separate their warranty costs by division or by product line. Carrier is part of United Technologies. York International was acquired by Johnson Controls. And Trane was acquired by Ingersoll-Rand. So any "industry" statistics would have to include the warranty costs of everything from hand tools to helicopters.
We suggested Goodman Global and Lennox International as good candidates for "pure play" HVAC companies, whose warranty costs could stand in as benchmarks for the industry as a whole. But because of that obvious hiccup in Goodman's late 2008 data, let's reduce that list to just Lennox.
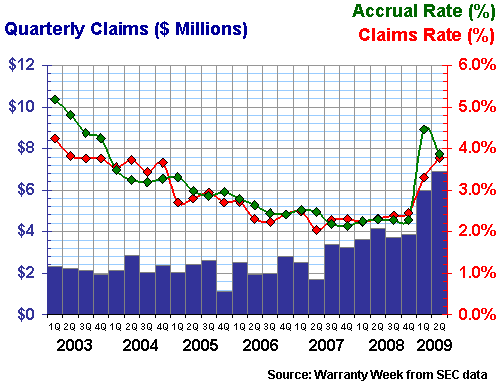
The data in Figure 5 may look like it has lots of peaks and valleys, but every data point is between 0.9% and 1.5%. In fact, 40 of the 52 data points are extremely close to the 1% level that we'd suggest is a good industry average. In other words, despite what other product lines might generate in terms of warranty costs, we'd suggest that the cost of warranty inside Carrier, York and Trane is around 1% of product revenue, give or take a bit.
Figure 5
Lennox International Inc.
Warranty Claims & Accrual Rates, 2003-2009
(as a percentage of product sales)
Despite its long-term consistency, Lennox has recently seen its warranty costs rise significantly above the baseline. Claims rose to 1.3% of product revenue in the first quarter of 2009 before falling back to 1.2% by June. Actual claims paid, however, are actually down year over year. It's a 23% decline in sales that drove the claims rate up. Accruals, meanwhile, have slowly risen from 0.94% to their current 1.16% over the past ten quarters.
Only once before has Lennox seen its warranty costs stray far outside the baseline. At the end of 2006, there was one quarter in which claims shot up to $10.4 million, and the claims rate jumped to 1.48%. By the first quarter of 2007, however, claims were back down to $7.7 million and the claims rate was back down to 1.2%.
Sudden Drops in Warranty Costs
Our next snapshot is of Nortek Inc., a diversified manufacturer with a presence in HVAC as well as electrical and lighting fixtures, with a sprinkling of consumer electronics thrown in as well. A little under half of Nortek's revenue comes from residential and commercial HVAC products. Around a third comes from the sale of kitchen range hoods and exhaust fans, and the balance of around 21% of revenue comes from the sale of speakers and subwoofers, audio/video wall mounts, power conditioners, surge protectors, and security products.
As seems to be common across these industries, Nortek experienced a sudden and unexpected drop in warranty expenses a year ago in the quarter ended June 28, 2008. Thanks to a reimbursement from an unnamed former supplier, the total for net claims paid suddenly fell to $1.4 million, down significantly from its $6 million average. As a result, the claims rate suddenly dove to only 0.2% of revenue.
And then in the fourth quarter of 2008, claims jumped to an unusually high level of $11.5 million, and the claims rate rose to 2.3%. It was as if the company was compensating for its good fortune six months before. Thanks to an even larger $13.6 million accrual made during that fourth quarter, the accrual rate jumped even higher, to 2.7%.
Figure 6
Nortek Inc.
Warranty Claims & Accrual Rates, 2003-2009
(as a percentage of product sales)
So far this year, both claims and accruals are back to normal. But the year-over-year comparisons still look somewhat ugly. At 1.4%, the current claims rate is more than six times as high as it was in June 2008, while at 1.5% the current accrual rate is almost three times as high as a year ago. The chart below, however, makes it instantly clear why the year-ago comparisons are so brutally bad.
When it's time for the annual reports to be examined in March 2010, Nortek will show incredible improvements. On the one hand, it won't mean much, because as time goes by it becomes obvious that last year's second and fourth quarters were anomalies. But on the other hand, even if both of these unusual quarterly measurements are disregarded, the company's warranty costs are still creeping upward on a trend line that stretches back almost three years.
Kitchen Cabinet Warranties
Next, let's look at two companies in the business of making cabinets. Well, Masco is actually a conglomeration of multiple separate product lines, including KraftMaid and Merillat cabinets, Delta and Peerless plumbing fixtures, Behr paints, and Arrow Fastener hand tools, among others. Plumbing is currently around a third of revenue while cabinets are around 21% of total revenue.
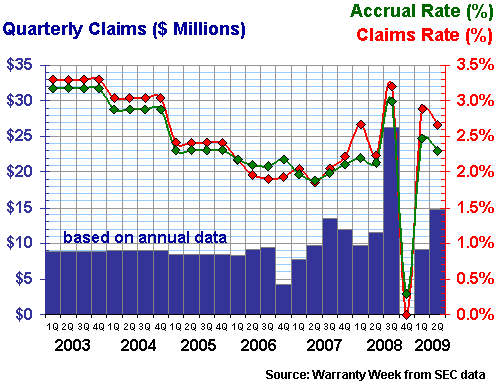
In the mid-year report published on Sep. 25, 2008, we noted that Masco's claims rate was up a bit while its accrual rate was down a bit. This year, both rates are down significantly.
In the first half of 2009, Masco paid $19 million in claims, down from $28 million in the same period in 2008. But because sales also fell, the claims rate was reduced only slightly, from 0.7% to 0.6%. Accruals fell from $23 million to $11 million. And the accrual rate fell from 0.6% to 0.3%.
Figure 7
Masco Corp.
Warranty Claims & Accrual Rates, 2003-2009
(as a percentage of product sales)
We should note that Masco's accrual rate hit a rock-bottom 0.1% level in the first quarter this year, because the company set aside only $2 million in accruals while reporting more than $1.5 billion in product revenue. That and other factors helped to shrink the warranty reserve by $13 million over the past year to its current balance of $112 million.
Pure Play in Cabinetry
American Woodmark is more of a "pure play" in kitchen cabinetry. And although retailers such as Lowe's and Home Depot account for the bulk of sales, the company also sells its cabinets to homebuilders through a mix of dealers, distributors, and direct channels.
The company says its sales are seasonal, but there's no seasonal pattern evident in Figure 8. Instead, it looks like warranty costs were climbing for three years, peaked at the end of 2005, and have been falling ever since.
In the past year, American Woodmark's claims rate fell from 2.0% to 1.6%, while the accrual rate fell from 1.8% to 1.6%. Both percentages are now at their lowest levels since warranty reporting began in 2003. The company's fiscal year ended on April 30, so we're actually comparing two complete years rather than the midpoint of each calendar year.
Figure 8
American Woodmark Corp.
Warranty Claims & Accrual Rates, 2003-2009
(as a percentage of product sales)
American Woodmark is a spin-off of the wood and paper goods company Boise Cascade. It was management-owned from 1980 to 1986, and then it went public in July 1986. Product sales were down 9% in its latest fiscal year, which place it just below Goodman in terms of least declines.
Bedding Manufacturers
Finally, we'd like to conclude our eight-week travelogue of the warranty industry with a pair of snapshots of two of the leading makers of mattresses and pillows. Sealy is the largest, through both its own brand name and through the Stearns & Foster brand name that it controls. Simmons is a bit smaller, and is actually undergoing a Chapter 11 bankruptcy reorganization that may very well end up with the company being taken private. So this may very well be the first and last time their warranty costs are compared in a single article.
Perhaps compare is the wrong word. One cannot compare the warranty costs of two different companies unless both companies make the same product, cover it with the same warranty terms and conditions, and count all their warranty costs the same way. A quick glance at the differences in Figures 9 and 10 shows that not to be the case.
Sealy has seen its claims rate rise steadily from 0.8% at the beginning of 2007 to 1.5% at the end of May 2009. Over those same ten quarters, it has varied its accrual rate all the way from 1.8% down to 0.7%.
Figure 9
Sealy Corp.
Warranty Claims & Accrual Rates, 2003-2009
(as a percentage of product sales)
Simmons, meanwhile has kept its warranty costs very low for the past four years. During the fourth quarter of 2006, it reported only $5,000 in net claims paid, dropping its claims rate close to zero percent. Claims were actually at a four-year high earlier this year, when the company paid out $901,000 in claims on $223 million in sales, for an 0.4% claims rate.
And then Simmons filed for bankruptcy protection in September, and it immediately asked the court's permission to be acquired by Ares Management LLC and Teachers' Private Capital, the private investment arm of the Ontario Teachers' Pension Plan. Significantly, these companies already control one of the privately-held manufacturers that own the Serta brand name. Therefore, if this bankruptcy reorganization and merger goes through, the U.S. bedding industry will be dominated by Sealy and Stearns & Foster on one side and Simmons and Serta on the other side.
Figure 10
Simmons Co.
Warranty Claims & Accrual Rates, 2003-2009
(as a percentage of product sales)
Additional warranty data for the bedding industry is available for smaller and more specialized competitors such as Select Comfort Corp. and Tempur-Pedic International Inc. Select Comfort's warranty costs seem to be closer to Sealy's level, which is understandable given their adjustable "Sleep Number" inflation technology.
At the midpoint of 2009, Select Comfort's warranty claims rate stood at 1.2% while its accrual rate was 1.0%. Both figures are down from a year before, though so are sales. Historically, the company's claims rate has generally stayed close to 1.5% of sales.
Meanwhile, Tempur-Pedic's costs are closer to the Simmons level. Its latest claims rate is 0.6%, while its latest accrual rate is 0.5%. Both figures are up from a year ago, though the 0.4% to 0.6% range is generally where both ratios have been for the past three-and-a-half years.
Conclusion
Thus concludes our eight-part report on the top U.S.-based warranty providers as of the middle of 2009. Manufacturers are now busy reporting their third quarter financial figures, and by March 2010 we should also have their year-end 2009 figures on file.
Readers should use the links below to navigate between the different pieces of the report. Readers should also feel free to check in with the newsletter archive list to find corresponding industry reports from the midpoint and end of previous years. Though the companies pushed into the spotlight change from year to year, the list of top warranty providers in any given industry sector always remain the same.
| Part One: Top 100 Warranty Providers |
| Part Two: Automotive Industry |
| Part Three: Computer & Disk Drive Industries |
| Part Four: New Home Builders |
| Part Five: Aerospace Industry |
| Part Six: Medical Equipment & Scientific Instruments |
| Part Seven: Telecom & Data Networking Equipment |
| Part Eight: HVAC, Appliances & Building Materials |


