


Warranty Reserves vs. Accruals, Part One:
With 32 quarters of data, it's becoming easier to see which companies carefully calibrate their warranty budgets and which make it up as they go along. Here are the "scores" for the top three in each of six industries.
Now that annual totals for all 14 warranty-issuing industry segments have been charted in detail for the years 2003 to 2010, spanning the newsletters published between April 1 and June 9, 2011, it's time to look at the key ratios of individual companies in the automotive and homebuilding industries.
The thing about warranty metrics is that while some represent what happens to your company and to your products, some represent what you think will happen, or what you think is appropriate.
For instance, the warranty reserve balance is basically accruals minus claims. And accrual rates are decided by a company's own finance team. And by manipulating the accrual rate, a company can adjust the ratio between claims and reserves.
Warranty Marksmanship
So in a way, an external observer can rate the "marksmanship" of a company's finance team by how well they control the metrics they are able to control. And with eight years of warranty data now in hand, each "target" is now quite full of holes. Some of the holes are in tight groupings, while other seem almost randomly distributed.
In the following six charts, we're tracking the warranty "marksmanship" of the top three warranty providers in each of six industries. On the horizontal axis, we're charting each company's accrual rate, calculating a percentage by dividing each period's accrual total by the corresponding product sales total.
This measures the company's expectations for its future warranty costs, as a percentage of sales. For instance, if a company sells a product for $1,000 and always sets aside $20 per unit to finance future warranty claims, its accrual rate would be 2.0% of sales. If the price of the product is cut to $800 but accruals remain at $20 per unit, the accrual rate would rise to 2.5%. If the price remained the same but accruals were increased to $30 per unit, the new accrual rate would be 3.0%. And so on.
On the vertical axis, we're taking the closing balance in each company's warranty reserve fund, and dividing it by the monthly total for claims payments at the end of each quarter. This measures the capacity of that reserve fund to pay claims, expressed in months. For instance, if a warranty reserve fund holds $12 million and the company is paying out $2 million a month in warranty claims, the reserve capacity is six months. If claims rise to $3 million a month but the reserve balance remains at $12 million, the reserve capacity would fall to four months.
A company chooses the amount it considers to be sufficient to hold in warranty reserve, by increasing or decreasing its accrual rate. But if claims rise and reserves don't, then the company is setting itself up sooner or later for a negative earnings event, where net income has to be cut because additional funds have to be allocated. Conversely, if the reserves are more than able to cover future claims, then funds are sitting idle when they could be added to net income.
It's been more than five years since Warranty Week has made these comparisons, which is partly a simple oversight and partly a product of the tremendous amount of calculations involved. Each of the charts below contains 32 accrual rate measurements per company (four quarters per year over eight years), and 32 reserve capacity measurements per company, with three companies per chart. So that's a total of 192 calculations per chart.
U.S. Averages
On each chart, the intersection of the blue lines represents the average for all U.S.-based manufacturers at the end of 2010. The average accrual rate for the 514 manufacturers that have so far published their 2010 warranty expenses was 1.39%. Their average reserve capacity stood at 16.7 months, based on $33.661 billion in reserves measured at year's end and a rate of $2.014 billion in claims payments per month in December 2010.
In Figure 1, we've charted the top three U.S.-based makers of vehicles, which just happen to be two passenger car makers and one construction/truck maker. A quick look reveals that General Motors has both the highest accrual rates and the largest reserve capacity.
Figure 1
Warranty Reserves vs. Accruals
Top Three Mfg. in the Vehicle Industry
(in months of claims & % of sales, 2003-2010)
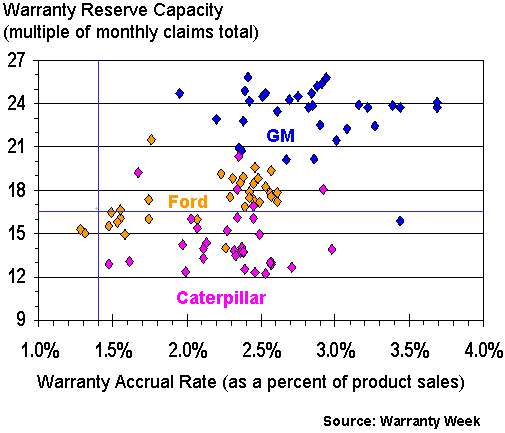
None of the 96 reserve capacity measurements was below 12 months, and only two of the accrual rate measurements were below the industry average (to the left of the blue line). These were, in fact, the two most recent measurements of Ford's accrual rate, at the end of the third and fourth quarters of 2010.
It's a shame we can't add a label to each of these points for elapsed time, because the cluster one sees for Ford around 18 months and 2.5% is primarily the 2003-2006 data. Since then, the accrual rate has fallen while the corresponding reserve capacity has drifted both higher and lower than 18 months.
In contrast, GM has seen its accrual rate fall and has kept the ratio between claims and reserves close to 24 months. And Caterpillar has been all over the place.
Reducing Warranty Accrual Rates
Back in 2006, when there was less warranty data, some of these companies had data points in a much tighter cluster. But as they implemented changes that resulted in higher product quality and lower warranty costs, they weren't as careful about monitoring the size of their reserve fund (as a multiple of their monthly claims payments). Then again, the recent recession and its effects on sales and costs did a lot to upset these ratios.
But we're still suggesting that there's an aspect of marksmanship to this data. If a given company's data points are in a tight cluster, it suggests they have a careful approach to their warranty accruals and reserve balance management.
For a better example, let's look at Figure 2. Here, we're charting the top three makers of automotive systems and parts -- the suppliers to the companies in Figure 1. And while the data points of TRW Automotive Holdings and Johnson Controls are somewhat mixed together, all 64 of them are on the left side of the blue line. And all 32 of the Cummins data points are to the right.
If you correlate this with what they make, it spotlights an important difference. While the makers of parts for steering, chassis, brakes, interiors, and batteries typically have lower-than-average warranty costs, the makers of engines and transmissions are typically higher than average.
Figure 2
Warranty Reserves vs. Accruals
Top Three Mfg. in the Auto Parts Industry
(in months of claims & % of sales, 2003-2010)

And indeed, the Cummins data is clustered around three percent -- closer to GM's own accrual rate than to GM's suppliers. In terms of reserve capacity, one of the big surprises is that TRW keeps two, three, and sometimes more than four years' worth of reserves on hand. And the other is that Johnson Controls' acquisition of an HVAC company hasn't driven its reserve capacity above two years.
Removing Anomalies
We should mention, however, that in the case of Cummins, we removed one outlying data point. Towards the end of 2005, the company's claims and accrual rates suddenly and temporarily plummeted. But the warranty reserve balance was largely unaffected. However, with the accrual rate at one percent and the claims rate even lower, the reserve capacity suddenly shot up to 87 months.
We thought about also deleting the outlier for TRW, but it seems more like the extreme point of a pattern and less like a true anomaly. The company has kept its accrual rate and reserve balance in a tight range over the past eight years, but for whatever reason, there was one quarter in early 2006 that was a little light on claims. So the reserve capacity shot up to 56 months.
In aerospace, one would expect to find stable and unchanging warranty metrics, given how steady and predictable product quality and performance tends to be. But one look at Figure 3 reveals this to be a false hope. With Boeing, we have a fairly stable accrual rate but a fluctuating reserve capacity. With Textron, we have a fairly stable reserve capacity but a fluctuating accrual rate. And with Honeywell, we have a scattered set of data points with no obvious pattern.
Figure 3
Warranty Reserves vs. Accruals
Top Three Mfg. in the Aerospace Industry
(in months of claims & % of sales, 2003-2010)
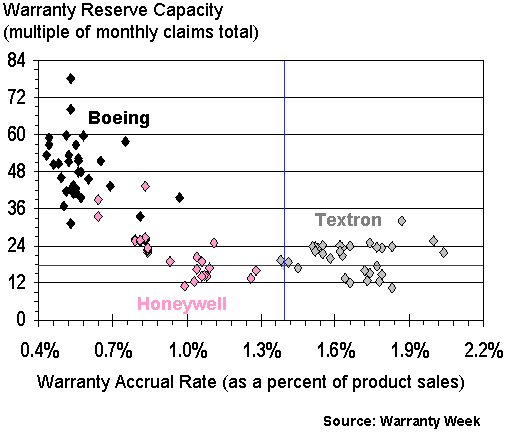
Also, note that while Boeing's accrual rate is below the U.S. average, Textron's is above it. Most likely, this is because while both companies make civilian airplanes, Boeing's other line of business is military while Textron's is forklifts and lawn equipment. And we'd suggest that the land vehicles typically throw off more warranty cost than the air vehicles.
Meanwhile, Honeywell has interests not only in the aerospace industry, but also in automotive, HVAC, and semiconductors. It's likely that this multi-industry structure and diverse product line is behind the wide range seen in Figure 3. When it comes to warranty costs, whatever's selling at the time is in the driver's seat, if you'll pardon the pun.
United Technologies, which could have fit right into Figure 3, is instead part of Figure 4 because of its ownership of Carrier Corp. Its accrual rates are very close to the U.S. average -- sometimes above and sometimes below -- as are the numbers posted by Ingersoll-Rand. In fact, the appliance/HVAC companies in Figure 4, the aerospace OEMs in Figure 3, and the automotive OEMs in Figure 1 seem to have a lot in common.
Figure 4
Warranty Reserves vs. Accruals
Top Three Mfg. in the Appliance/HVAC Industry
(in months of claims & % of sales, 2003-2010)
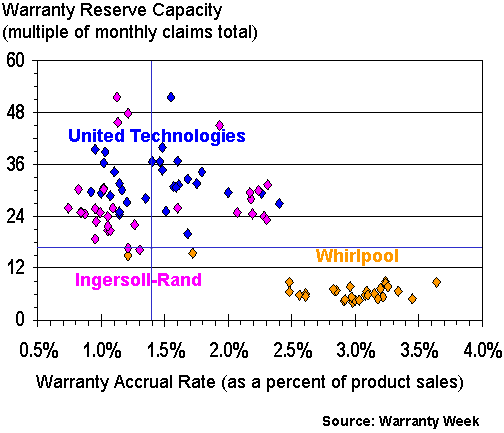
We omitted one data point for Ingersoll-Rand and two data points for Whirlpool. So there are only 93 data points in the chart above. The IR anomaly came in late 2004 when the quarterly claims rate dropped precipitously. The Whirlpool anomalies came in the middle of 2007 and at the start of 2010 when the accrual rate temporarily soared above five percent.
The data also shows that Whirlpool is keeping less than a year's worth of funds in its warranty reserve. But at least it's consistently doing this, rather than letting the balance rise and fall of its own free will. The proof of this is how controlled these ratios remained even after the acquisition of Maytag.
Meanwhile, IR and UTC have data points over much broader areas than Whirlpool. One reason may be IR's acquisition of Trane, which changed the company's product mix quite significantly. Another might be the diversity of each company's existing warranted product line, which may be more of a factor for UTC but is also a factor for IR.
Reserve Capacity vs. Warranty Duration
As was mentioned, the U.S. average is now at 16.7 months (though it was as high as 17.7 months way back in early 2003). This implies that the average warranty's duration is 16.7 months, though of course some companies keep more than they need and some keep less than they need in their reserve fund.
We'd like to think that the capacity of a given reserve fund to pay claims is a function of the length of the company's warranties. That's the way is must be with extended warranties, and that's the way it should be for product warranties. In other words, all things being equal, companies issuing 60-month or 120-month warranties would need to keep a higher level of reserves than companies issuing 12-month or three-month warranties.
And to some extent, that theory is proven right by companies such as Boeing, Ingersoll-Rand, and United Technologies. But it's refuted by the evidence of Whirlpool, Textron, and Caterpillar, whose reserves seem less-than-fully stocked, given the typical length of their product warranties.
But inconsistency in warranty metrics is a relative thing. Take a look at Figure 5, for instance. In the homebuilding industry, where 12-24-month warranties and one percent accrual rates are typical, reserve capacities and accrual rates among just these three top homebuilders have been all over the map.
Figure 5
Warranty Reserves vs. Accruals
Top Three Builders of New Homes
(in months of claims & % of sales, 2003-2010)
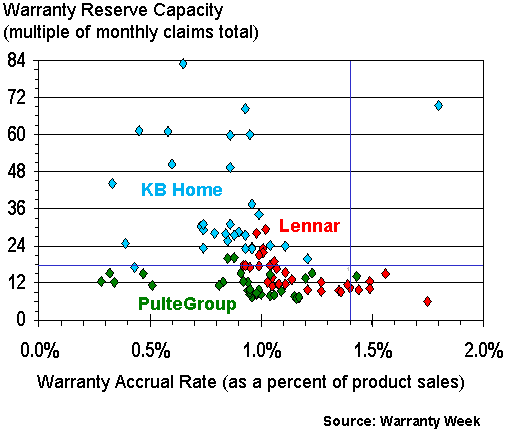
Granted, this industry segment has been battered by the recession and by product-related disasters such as mold and Chinese drywall. We discussed these problems at some length in a May 19 newsletter. But there still seems to be an abundance of discretion in the data that causes us to wonder if they're just making it up as they go along?
For while there's no absolute rule that a warranty reserve must contain enough funds to pay all claims likely to arise from all products sold to date, one would think that any auditor would want to see rates aligned with actual costs and warranty durations. Yet one of these homebuilders saw fit to triple its accrual rate one quarter and cut it in half the next.
Next Week: High Tech Industries
Next week, we'll take a look at how the other half lives: the high-tech computer and electronics industries. This week, we'll end the roundup with a look at the top three makers of warranted building supplies, tools, fixtures and furniture.
Figure 6 coincidentally shares its color scheme with Figure 3. But it also seems to share a data distribution pattern to some extent. Like Boeing, Stanley Black & Decker's reserve capacity data is both high and low. But unlike Boeing, the Stanley Works went through a significant recent merger that changed the nature of its product line significantly. So it's more a case of Stanley before and Stanley after the merger.
There is, however, one instance in late 2003 when the company reported almost no claims and also cut its accrual rate to the bone. The reserve capacity soared to 219 months, a measurement that we've omitted from Figure 6. The company's data was so consistent before and after that event that we'll just assume it was caused by some peculiar timing.
Figure 6
Warranty Reserves vs. Accruals
Top Three Makers of Building Materials & Hardware
(in months of claims & % of sales, 2003-2010)
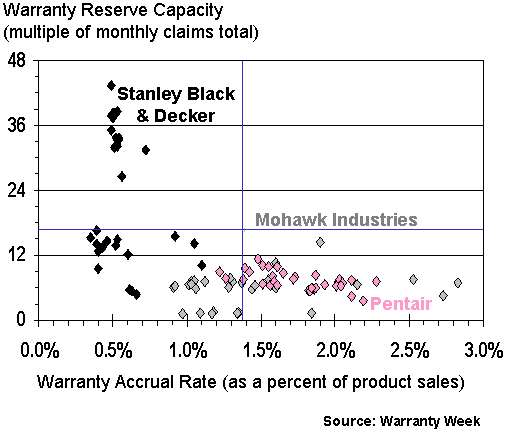
Pentair is actually one of the most consistent of the 18 companies we've charted this week. Most of its 32 data points are very close to the 7.5-month and 1.7% mark, which is where one would expect to find a maker of pool pumps and electronic controls.
The same can't be said for carpet maker Mohawk. As we detailed in the May 26, 2011 newsletter, the company had to take back nearly its entire run of commercial carpet tiles when the backing adhesive proved to be defective. And that no doubt accounts for much of the horizontal range of the accrual rates seen in Figure 6.
Warranty Marksmanship Reconsidered
Way back in the May 16, 2006 newsletter, we wrote about something we called "warranty marksmanship." A tight cluster of dots (then numbering only 12 per company) was taken to be a signal that the financial skills of those deciding upon the rates and levels were the best at what they did.
"Take them to the carnival and they'll win the biggest plush toy," we wrote at the time, "as if a marksman had taken aim at the target and landed every shot."
Five years later, we now see that a continuous program of warranty cost reduction, as is on the agenda at Ford, Caterpillar, United Technologies, and Whirlpool, just to name a few, can result in a meaningful change in accrual rates over time. So it's not a sign of terrible aim to see a horizontal spread like Whirlpool's. In fact, it's the result of a continuous improvement in product quality.
But we still think an excessive vertical diffusion is a sign that a company is not doing its best to monitor warranty costs after the sale. If accruals prove to be overabundant or insufficient once claims start coming in, reserve levels should be adjusted accordingly.
And then there are the companies that seem to close their eyes and shoot. We can only hope that they're choosing their accrual rates based on some realistic methodology, and not just throwing darts at a board. And while there's little they can do once a product is sold to affect the amount of claims they pay out each month, they most certainly could do a better job than to let the ratio between claims and reserves to vary from one to seven years.


