

Automotive Warranty Report:
For the first nine months of 2013, claims are up a bit from 2012 levels while accruals are down. More importantly, the percentage of revenue spent on warranty work is down as well. That means manufacturers expect to see lower warranty costs in the future, as they make more reliable vehicles that cost less to repair.
There's no better way to start a new year than to take a look back at the year gone by. And there's no better place to start than with automotive warranty metrics.
Historically, the automotive sector has accounted for around 40% of all warranty expenses for all manufactured goods. And so far, based on the data available for the first nine months of 2013, we're even a little ahead of that level.
However, the automotive sector also is one of the first to implement early warning, warranty analytics, and other technologies that have used warranty data to help reduce warranty expenses. So the data they generate is itself a leading indicator as far as manufacturing trends.
Warranty Metrics Methodology
To measure warranty expenses in this industry sector, we began with a roster of 155 U.S.-based companies primarily engaged in the automotive manufacturing business, including not only passenger cars but also trucks, motorcycles, vocational vehicles, forklifts and certain types of farm and construction vehicles. We then separated them into two groups: 48 OEMs and 107 parts suppliers.
The leading OEMs include companies such as General Motors Co., Ford Motor Co., Caterpillar Inc., Deere & Co., and Navistar International Corp. The roster of leading parts suppliers includes Cummins Inc., Eaton Corp. plc, Standard Motor Products Inc., Delphi Automotive plc, and Brunswick Corp.
Warranty expense metrics were gathered from the quarterly and annual reports of these OEMs and suppliers from the beginning of 2003 until the third quarter of 2013. For companies on a staggered fiscal year, the financial report that ended in the months of July, August, or September was the latest one examined.
We gathered figures for warranty claims paid, warranty accruals made, and the balance left in the warranty reserve fund at the end of the quarters. We also compiled figures for warranted product sales -- including no service revenue, no finance revenue, no royalties or logo apparel sales. That way, we could calculate what percentage of product sales were going towards warranty expenses.
Claims Paid
By the end of March, we should have complete 2013 figures, once all the annual reports are filed with the U.S. Securities and Exchange Commission. For now, we have just nine-month figures. And during the first nine months of 2013, U.S.-based automotive companies paid out $7.57 billion in warranty claims, slightly more than they did in the same period of 2012. The OEMs paid out $6.5 billion, about 2% more than in 2012. But the suppliers paid out only $1.07 billion, about 5% less than they did in 2012.
In the chart below, we've tracked the claims payments of both the OEMs and their suppliers over the past 43 quarters. As can be seen, claims payments peaked in late 2007 and in 2008, fell into a trough in 2009 and 2010, and then recovered and stabilized in 2011 through 2013.
Figure 1
U.S. Automotive Industry
Warranty Claims Paid, 2003-2013
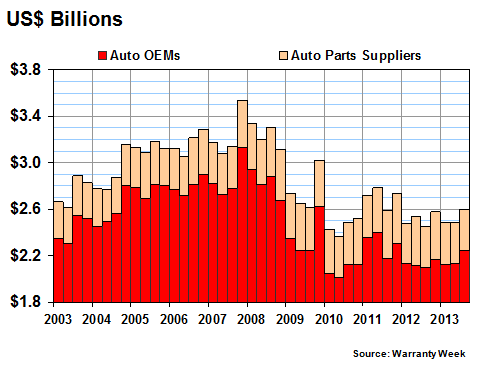
Claims payments actually bottomed out in early 2010, roughly a year after sales did, because of the lag time between when a vehicle is sold and when it typically needs warranty work. And claims didn't rebound as fast as sales have in the past five years because frankly, the vehicles being made now have needed less warranty work than before.
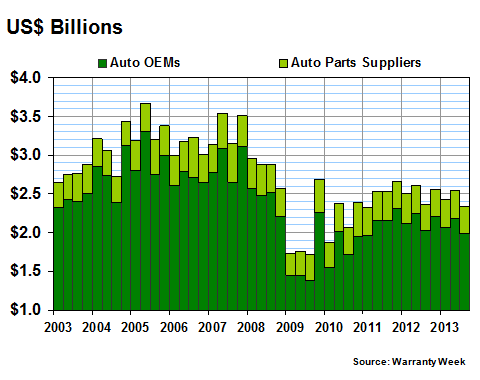
Accruals Made
Warranty accruals are much more closely coupled to sales. When a vehicle is sold, the manufacturer is supposed to set aside the amount its forecasters predict will be the cost of the required warranty work. For instance, for a passenger car they might set aside $500 every time a vehicle is sold, placing these accruals into a warranty reserve fund. When the bills come in after the warranty work is done, the money is then spent on warranty claims.
If no vehicles are sold, no accruals are made. If sales fall by half, so do accruals. If sales double, so do accruals. Therefore, in Figure 2 it's much easier to see the bottom of the trough in 2009. During the first nine months of 2009, the automotive OEMs and their suppliers made only $5.2 billion in accruals. During the first nine months of 2013, their accruals were back up over $7.3 billion.
Figure 2
U.S. Automotive Industry
Warranty Accruals Made, 2003-2013
It's been almost five years since General Motors and Chrysler LLC went bankrupt, and the U.S. Dept. of the Treasury took the unprecedented steps of temporarily assuming ownership of the companies and guaranteeing their warranties. Chrysler filed for Chapter 11 bankruptcy on April 30, 2009 and GM filed on June 1, 2009.
Meanwhile, Fiat S.p.A. first announced its intent to buy a minority stake in Chrysler on Jan. 20, 2009. And just last week, Fiat announced its intent to buy all 100% of the company, hopefully by Jan. 20, 2014. As control of Chrysler passed from Daimler AG to Cerberus Capital Management to Fiat, there's never been an opportunity to include Chrysler data in the charts above. However, that may change depending upon how the combined companies structure their U.S. entity and how they reports its warranty expenses to the SEC.
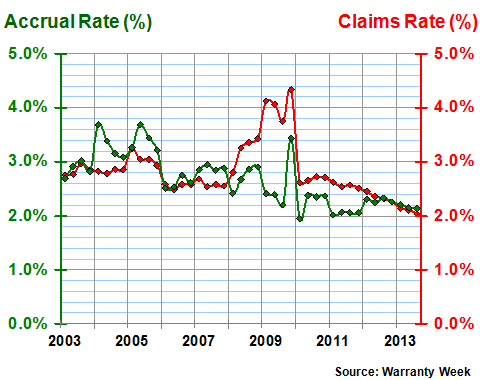
Percentage of Sales
In Figures 1 and 2, we've charted two pair of totals for claims and accruals for the OEMs and their suppliers over 43 quarters. For each of those 172 totals, we've also calculated product sales totals for the companies in each group.
In Figure 3, we're dividing the claims and accrual totals by those sales totals, so that each type of warranty expense can be expressed as a percentage of sales. As can be readily seen, the OEMs spend a much higher percentage of their sales revenue on factory warranty expenses than do their suppliers.
Figure 3
U.S. Automotive Industry
Average Warranty Claims & Accrual Rates
(as a % of product sales, 2003-2013)

In general, from 2003 to 2008, the OEMs spent about 2.5% of their automotive sales revenue on warranty expenses. Their suppliers spent about 0.6%. So the gap between them was around 1.9%.
Forget 2009 -- claims spiked as sales dove, and the averages went haywire. But as things returned to normal, from 2010 to 2013 the OEMs gradually reduced their warranty spending rates to around 2.0% of revenue, while their suppliers saw their bills rise to around 0.7% and then for the most part to remain around 0.6% to 0.7%. So the gap is now around only 1.3%.
To put it another way, the recession saw the spending rates of both the OEMs and suppliers to rise. But during the recovery, the OEMs saw their rates fall, while their suppliers didn't. So now, the OEMs spend one-fifth less than they did before, while their suppliers spend about the same percentage as before. In other words, the OEMs have shifted some of their warranty costs to their suppliers, and have also reduced their warranty costs by making a better product.
If the OEMs had passed on all the efficiencies of building a better product to their suppliers, the gap would not have narrowed by so much. As the OEMs fell from 2.5% to 2.0%, their suppliers would have fallen from 0.7% to perhaps 0.5%. However, the good news is that in 2013 the suppliers seem to have finally dipped below 0.6%. So for both groups, the trend is now downwards.
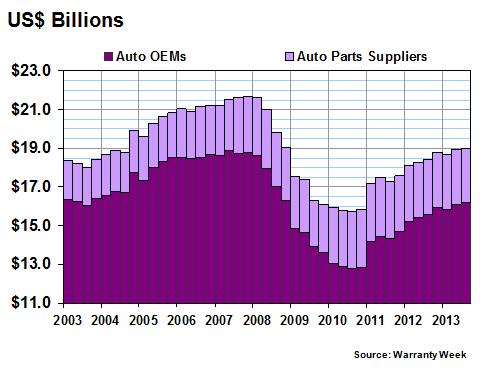
Keeping Adequate Warranty Reserves
The combined effect of lower claims and lower accruals translates into smaller balances in the warranty reserve funds of the 155 companies. In Figure 4, we can see that the combined balances of the OEMs and suppliers peaked at the end of 2007, at a level of $21.7 billion. About 87% of that total was in the hands of the OEMs, while 13% was in the hands of their suppliers.
Warranty reserves dipped under the $16 billion level during 2010, before beginning to rise again. By the end of September 2013, the combined level was back up to $19 billion -- roughly at 2004 levels once again.
Figure 4
U.S. Automotive Industry
Warranty Reserves Held, 2003-2013
Now we want to change the focus from the entire U.S.-based industry to just the General Motors portion of it. This year we can do that because Delphi Automotive has finally emerged from bankruptcy and has resumed disclosing its warranty expenses, while Allison Transmission Holdings Inc. went public around 10 months ago.
GM owned Allison from 1929 until 2007. It owned Delphi until it was spun off in 1999. We also include in the GM family two more distant siblings: Terex Corp., which GM owned until the 1980s, and American Axle & Manufacturing Holdings Inc., which GM owned until 1994.
Depending upon the year and the warranty metric considered, these five companies have accounted for between 32% and 42% of the entire U.S.-based automotive industry's warranty expenses. So far in the first nine months of 2013, we're at the lower end of that scale, with these five companies accounting for 32% of claims paid and 35% of accruals made.
GM Spends Less on Warranty
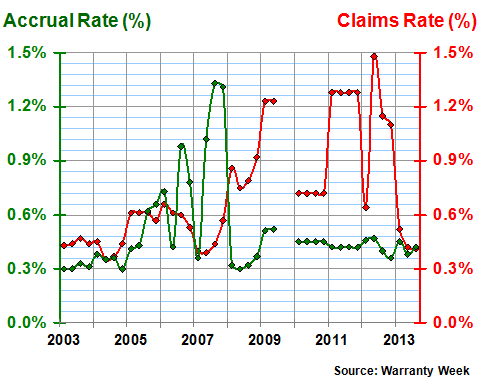
GM of course is the largest among them. And it's not only the largest U.S.-based warranty provider in the automotive industry, but in any industry (although its lead on Apple Inc. is narrowing). In Figure 5, we can see why: while Apple sells ever more iPhones and grapples with governments that insist on longer warranties, GM is spending a much smaller net percentage of its sales revenue on factory warranty costs.
Figure 5
General Motors Co.
Average Warranty Claims & Accrual Rates
(as a % of product sales, 2003-2013)
GM is spending only about two percent of its automotive revenue on warranty work -- half as much as it spent during the dark days of 2009. How many large manufacturers can say they've cut their claims rate in half in five years? How many can say they are currently enjoying their lowest claims rates of the past 11 years? It's a very short list.
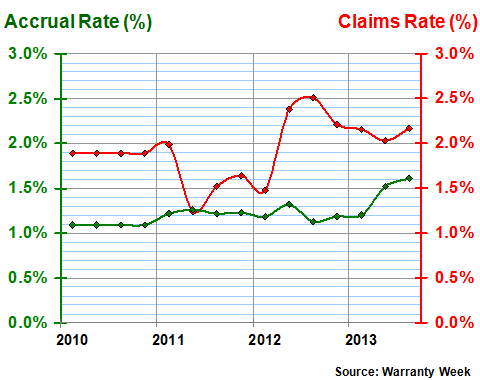
Delphi, meanwhile, has now emerged from its bankruptcy reorganization, and has resumed the financial reporting it discontinued in 2009. However, the data it provided for 2010 and 2011 was annual-only, so in Figure 6 we've stretched the claims and accrual rates we calculated for the 12-month period over the four quarters of each year.
Figure 6
Delphi Automotive
Average Warranty Claims & Accrual Rates
(as a % of product sales, 2003-2013)
Delphi's claims rate hit a new high in 2012, but it's back to the "normal" range in 2013. Its accrual rate, meanwhile, has remained very close to 0.4% or 0.5% for most of the past 15 quarters. Hopefully, its claims rate has now stabilized at a similar level.
Terex has been independent of GM for almost 27 years. It was initially launched as the construction equipment subsidiary of GM in 1968 (Terra + Rex = King of the Earth), but was sold off in stages between 1980 and 1987. It has made numerous acquisitions since then that have carried it into all corners of the heavy equipment industry. Most recently, it acquired its way into the line of business that manufactures the cranes that are used to load cargo containers at shipping ports.
Since 2003, its warranty expense rates have been fairly stable and predictable, with the exception of a manufacturing excursion emanating from its crane line of business at the end of 2009. However, the spike in the claims rate seen in Figure 7 was also partially caused by a dip in sales at the end of that year. Both its claims and accrual rates have remained close to one percent during recent years.
Figure 7
Terex Corp.
Average Warranty Claims & Accrual Rates
(as a % of product sales, 2003-2013)
Terex, like GM itself, is on our OEM list. Delphi, Allison, and American Axle are on the parts supplier list. In general, the drivetrain and engine manufacturers experience OEM-like warranty expense rates.
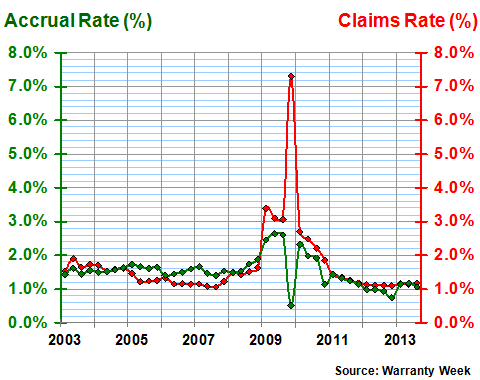
And that seems to be the case with Allison. The data for 2010 included in Figure 8 below was annual, so all four quarters were charted at the same rate. But in general, the truck transmission manufacturer has kept its claims rate close to two percent while its accrual rate has averaged 1.3%.
Figure 8
Allison Transmission Holdings Inc.
Average Warranty Claims & Accrual Rates
(as a % of product sales, 2003-2013)
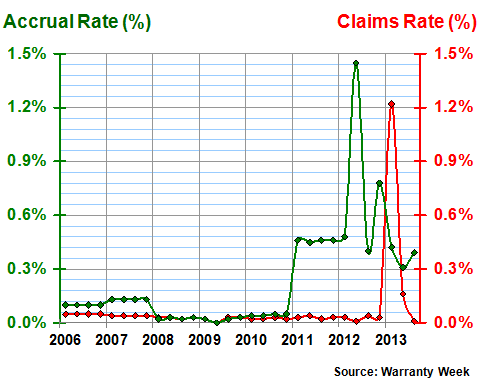
American Axle has kept its claims and accrual rates very close to zero for most of the past eight years. However, a quick look at Figure 9 suggests that the company saw something ominous coming in 2012, when it raised its accrual rate to an unprecedented 1.4% level. And then nine months later, the bills came due, and its claims rate briefly rose to 1.2%. Now, both rates are far below their peaks.
From 2006 to 2010, American Axle was largely protected from having to pay its own warranty costs by the terms of its contractual arrangements with GM. However, it began sharing warranty costs with GM in 2011, and it also continued to add other customers for which warranty cost sharing was expected from the outset.
Not surprisingly, warranty accruals rose from $1.2 million in 2010 to $12 million in 2011, then $23 million in 2012. So far in 2013 they're back below the pace of 2011 at $8.9 million for nine months.
Claims payments rose from less than $1 million in each of the years 2006 to 2012 to $10.6 million so far in 2013, of which $9.2 million was paid in the first quarter of the year. Neither the customer involved nor the reason for the large payment was disclosed.
Figure 9
American Axle & Manufacturing Holdings Inc.
Average Warranty Claims & Accrual Rates
(as a % of product sales, 2003-2013)
Four out of five of these companies has faced a spike in its warranty expenses, and for each of them the bad news seems to be in the past. GM had an awful 2009. Delphi saw its spike in 2012. Terex hit a bad patch at the end of 2009. American Axle had its spike in 2012-2013.
The only company that hasn't seen its warranty expense rates soar is Allison Transmission. Then again, we have only 15 quarters of data so far. But let's hope that in warranty terms, the next decade is as uneventful as possible for all of these companies.
GWSCA Plans Warranty & Service Contract Awards
Recognizing that developing and sustaining exceptional warranty and service contract capabilities has become increasingly critical as the need to improve quality, and retain customers and competitive advantage grows in the recovering economy, the Global Warranty and Service Contract Association (GWSCA) has created a nomination form and process to reward companies who have harnessed these capabilities and achieve greater revenues at higher profitability, and healthier customer loyalty.
The GWSCA will recognize an exceptional few brand owners or companies that offer product warranties, and/or service contracts that are nominated for a Warranty and Service Contract Award, and meet certain criteria.
Nominations will be accepted in the following four categories:
- Excellence in Warranty
- Innovation in Warranty
- Excellence in Service Contracts
- Innovation in Service Contracts
Awards will be presented at the 2014 Warranty Chain Management Conference in March. Award recipients also will receive industry recognition in Warranty Week magazine.
To be nominated for an award in Warranty or Service Contracts Excellence, the GWSCA is looking for a company's ability to achieve sustained excellence (year over year) and continuity of excellence in more than one of the following areas:
- Warranty costs/cost to serve,
- Warranty or service contract reserves accuracy,
- Service contract Sales growth,
- NPI-related warranty/service contract management,
- Supplier cost recovery, management and collaboration, and
- Customer loyalty/channel management and collaborative customer and service practices.
Similarly, to be nominated in either "innovation" category, the GWSCA is looking for a company's use of innovation in warranty and service contracts, including utilizing new frameworks, approaches, technologies and the like, with the end result being a major improvement in warranty and or service contract, either internally with suppliers or customers.
Nominations must include a detailed description of areas of performance, and provide actual numbers to back nomination, to show that the organization has achieved excellence in warranty/service contracts, or has been innovative in these areas. Companies submitting a nomination must provide examples/exhibits of performance, financial and other relevant information (including description of time-frame processes or performance reflects and if practices/processes, performance are same or different today), provide a description of how performance was/is achieved (e.g. successful implementation of analytics, early warning, fraud detection, collaborative practices internally and with partners, etc.), discuss organizational structure and support mechanisms to accomplish performance, as well as what metrics were used internally and with partners to measure and achieve progress, and the impact on customers, as applicable.
Click here to download the form or visit the GWSCA website. Completed nominations can be emailed to gterry.hawkins@gmail.com or mailed to GWSCA, c/o Terry Hawkins, President, 740 Zorn Ave, 5C, Louisville KY 40206, USA. The deadline has been extended until January 17, 2014. Good luck!


