


Homebuilder & Supplier Warranties:
Unlike in the automotive industry, where the OEMs have compelled their suppliers to pay a larger share of warranty costs, the homebuilders are reducing their share by selling fewer new houses. It's the building material suppliers who have learned how to cut warranty costs by reducing their expense rates.
In the homebuilding industry, the suppliers have learned how to reduce their warranty expenses by cutting the percentage of product revenue they pay in claims. Meanwhile, the builders, lucky to still be in business after a desperate industry downturn, are pretty much still paying about as much as they always have per unit sold.
The way they split the industry's total warranty bills, which had been roughly 60% for the builders and 40% for the suppliers a decade ago, has now flipped to where the builders now pay only 40% and their suppliers pay 60%. However, that doesn't mean the builders have successfully shifted their expenses onto their suppliers. Instead, there was a severe downturn in new home sales, which dramatically cut the need for the builders to do warranty work. The suppliers, meanwhile, turned to a new set of customers: the owners of existing homes and the retailers that serve them, to make up for the downturn in new home building.
In general, what we've found is that the expense rates of the builders are more or less the same as they were a decade ago, while the expense rates of their suppliers are significantly lower. But the suppliers pay a significantly larger share of the total, because their sales revenue has grown much faster.
Home Builders & Building Materials
To reach these conclusions, we started with a list of 59 U.S.-based homebuilders and 119 companies that supplied the homebuilders with building materials such as roofing, carpets, doors, windows, pools, paint, stain, sealant, fixtures, furniture, siding, paneling, railings, or cabinets. More specifically, 29 of the suppliers made electrical or plumbing fixtures; 34 manufactured furniture; and 56 made an assortment of other building materials and/or tools.
The builders are led by companies such as Lennar Corp.; KB Home; PulteGroup Inc.; NVR Inc.; and D.R. Horton Inc. Their suppliers include manufacturers such as Stanley Black & Decker Inc.; Owens Corning; Mohawk Industries Inc.; Sherwin Williams Co.; and Tempur Sealy International Inc. Together they represent a group that paid well over $1 billion in warranty claims last year, and has paid out $548 million in claims during the first half of this year.
In this comparison, we excluded the manufacturers of appliances and heating, ventilation, and air conditioning systems. And we did this for two reasons. First, while the suppliers of building materials are shifting their customer base from new construction to existing homes, the appliance makers are already there, selling replacement units through retailers such as Lowe's, Home Depot and Sears. And that's a much larger business. In terms of warranty, the HVAC and appliance companies paid out almost three times as much in claims last year as did the builders and the makers of building materials combined.
Second, that industry sector is the domain of industry giants such as United Technologies Corp. and General Electric Co., which dwarf the warranty spending of the dozens of others with which they compete for HVAC and major appliance sales. Therefore, so that the HVAC and appliance companies wouldn't dominate the overall list, and so that UTC and GE wouldn't dominate the HVAC/appliance list, we excluded them from this week's analysis. What we're left with is a much simpler comparison of the builders to their suppliers.
Reimbursements From Suppliers
In the August 21 newsletter, we identified the post-recession shift of warranty expenses by the automotive OEMs to their suppliers, which has reversed direction in recent months thanks to some spectacularly large recalls and manufacturing excursions. From 2009 to 2012, the OEMs seemed to have pushed extra hard for increased reimbursements of warranty expenses found to be caused by the products of suppliers. But then in 2013 they seemed to loosen their grip somewhat.
In the homebuilding industry, we see a similar trend, but speculate it's from a different cause. In Figure 1, we see a massive shift of warranty claims payments from the homebuilders (the OEMs in this industry) to their suppliers. But we think it has more to do with a shift in the customer base than with any conscious effort by the builders to make their suppliers pay more.
We took the total claims payments of the builders and their suppliers, and set them to equal 100%. So, for instance, back in 2003 the builders paid $813 million in claims and the suppliers paid $619 million. So the OEM share was around 57% for the year while the supplier share was around 43%.
We can see in Figure 1 that the builders' share remained close to 60% for the next four years, before it began to shift in 2008. But what was actually happening was not so much a shift as a decline in sales, which impacted the builders in a dramatic fashion.
Figure 1
Homebuilder Product Warranties
Claims Paid by Builders and Suppliers
(as a percent of the total, 2003-2014)
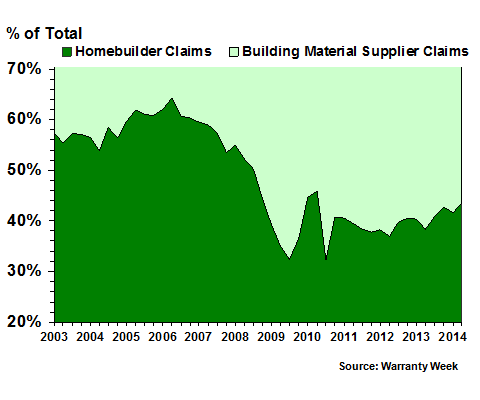
The suppliers' share exceeded 60% in 2009, but it was simply because their sales didn't decline as dramatically as did the new home builders revenue. And that was because the suppliers also supplied the contractors and owners of existing homes, who continued to remodel and upgrade their existing homes straight through the recession.
By 2011, the new home builders paid out only $399 million in claims -- less than half as much as they did in 2003 -- while the suppliers were paying out almost exactly the same amount: $624 million in claims that year. As a result, the builders' share of the total fell to 40%, while the suppliers rose to 60%.
And they stayed close to that 60/40 ratio from basically 2009 to the middle of 2014. So far in the first half of 2014, the builders have paid $227 million in claims to the suppliers' $321 million. A year ago, in the first half of 2013, these same builders paid $193 million in claims, while the suppliers paid $298 million. So while claims are up for both groups, they're up at a slightly faster rate for the suppliers.
Wide Swing in Accruals
The shift was even more dramatic in terms of warranty accruals, as can be seen in Figure 2. By the final quarter of 2005, the builders' share of the accrual total topped out at 66%. And then it began to plummet, crossing the 50% line in 2007 and hitting 25% in the depths of the recessionary year of 2009.
Figure 2
Homebuilder Product Warranties
Accruals Made by Builders and Suppliers
(as a percent of the total, 2003-2014)
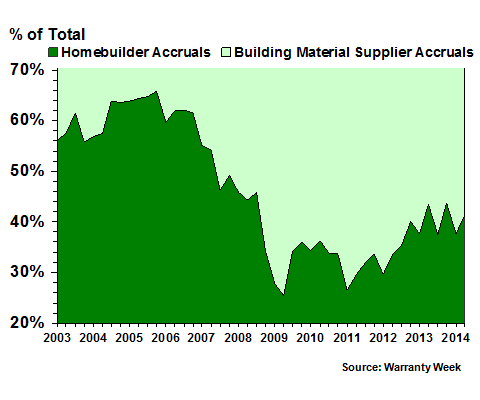
We've documented in columns such as the July 24 newsletter how some of the builders made absolutely no accruals at certain points. Theoretically, this means they thought they made perfect houses, but realistically they just simply didn't have the money, because they were selling so few new homes.
However, the suppliers of building materials continued to sell to existing homeowners and to their contractors, not to mention the retailers that act as their intermediaries. So again, rather than a shift from one group to another, what we're seeing is a massive decline for the builders and a slight decline by their suppliers.
In the peak year of 2005, the builders set aside $1.374 billion in accruals while their suppliers set aside $748 million in accruals. That resulted in a 65%/35% ratio.
In 2009, the builders set aside only $316 million in accruals while the suppliers set aside $705 million. That shifted the ratio close to 30%/70%, but again, it wasn't much of a decline for the suppliers.
So far in the first half of 2014, the builders have made $205 million in accruals while the suppliers have made $329 million in accruals. Those figures are up a bit from the respective $199 million and $288 million totals seen in the first half of 2013. But again, as was the case with warranty claims, this means that accruals are growing faster for the suppliers than they are for the builders.
Warranty Expense Rates
Growing expenses aren't usually a good thing, however. But in this case, the warranty expenses of the builders seem to grow in proportion with sales. So growth would be a good thing, if it were happening.
Actually, the accrual rate of the builders, calculated as the percentage of home sales revenue that they set aside as accruals, has recently hit a level that is close to a record low for them. And that's very good news, as long as it's not a sign that they're once again fiddling with accruals to conserve cash.
In Figure 3, we've taken the claims and accrual totals of the 59 builders, and divided them by the home sales revenue figures they each reported in their quarterly and annual financial reports. And as the chart shows, their average accrual rate fell below 0.9% for only the second time in the last 46 quarters.
Figure 3
U.S.-based Homebuilders
Average Warranty Claims & Accrual Rates
(as a % of product sales, 2003-2014)
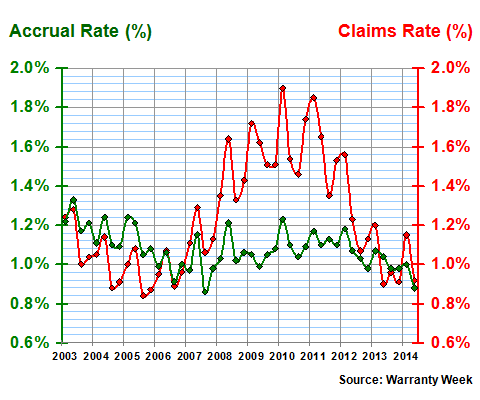
The builders' claims rate is lately at a low point as well. During the recession, as new home sales dried up, claims rates soared as builders had to fix last year's sales with this year's money. At the beginning of 2010, they were paying as much as 1.9% of their home sales revenue in warranty claims, which for a $200,000 item is a lot of money.
In the second quarter of 2014, however, they averaged a claims rate of only 0.9%, which is more or less what they've been seeing as their expense rate for four of the last five quarters. Their claims rates were lower at times during 2004, 2005 and 2006, but then came the recession.
The problem is, except for that recessionary bulge in claims rates, the builders have not seen a lot of change in their warranty expense rates over the past decade. Accrual rates in particular have remained very steady, except for those dips in 2007 and 2014.
Reducing Warranty Costs
Compare and contrast Figure 3 with Figure 4, which is the 11-1/2-year plot of the warranty expense rates of the building material suppliers. There's an obvious downward slope in their expense rates, from up around 0.8% to 0.9% in 2003 to 0.6% or below in the last 3-1/2 years.
Figure 4
U.S.-based Building Material Suppliers
Average Warranty Claims & Accrual Rates
(as a % of product sales, 2003-2014)
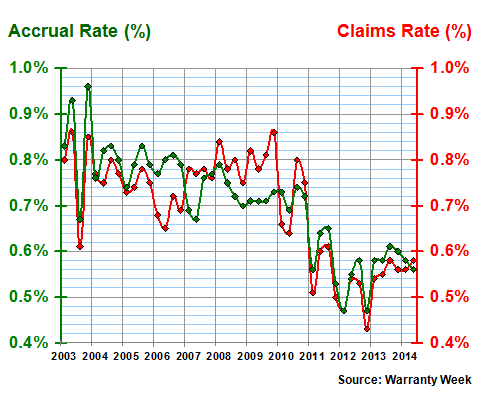
At the beginning of 2012 and then again at the tail end of that year, the suppliers cut both their claims rate and their accrual rate to less than 0.5%. Keep in mind that they did so at a time when they were paying more than 60% of the claims and making more than 60% of the accruals (see Figures 1 & 2).
In other words, their expenses were up but their revenue was growing faster. So while they paid a greater share of the building industry's total expenses, it was a shrinking share of their own revenue.
That's what makes this so different from the automotive industry. Both cars and new homes felt the pain of the recession first, and worst. Some saw sales decline by 50% or more in 2009 and 2010. But while the automakers shifted some of their warranty expenses to their suppliers during the subsequent recovery, the building suppliers shifted their customer base, boosting sales to owners of existing homes. And they cut their expense rates in the process.


