

Warranty Accruals for New Homes:
When a new home is sold, the builder sets aside a specific amount of money in the form of warranty accruals to cover its predicted warranty costs. Some builders do a consistently good job, accruing roughly the same amount per home sold from one season to the next. But others raise and lower their accrual rates over incredible ranges that seem to have little to do with predicted warranty costs.
In theory, new home builders are supposed to set aside enough funds when they sell a house to cover the cost of all the warranty work it will need until its warranty expires. In reality, only the builders that are really good at the financial aspects of warranty management do it this way. The rest just pick a number.
As with passenger cars, because the companies involved in the industry provide good data on unit sales volume, warranty expenses, and sales revenue totals, we can measure warranty cost in at least two ways. First, we can measure it as a percentage of revenue, and second, as a cost per unit sold.
The builders don't disclose how much they set aside per unit sold. However, anybody with a calculator can figure out the amounts, and how they change from one quarter to the next. So that's what we've done. As can be seen in Figure 1, the warranty accruals of the homebuilders are averaging about $2,500 per home sold, and that represents about one percent of their home sales revenue.
Figure 1
New Home Builders
Average Warranty Accrual Rates
($ per home and % of revenue, 2003-2015)
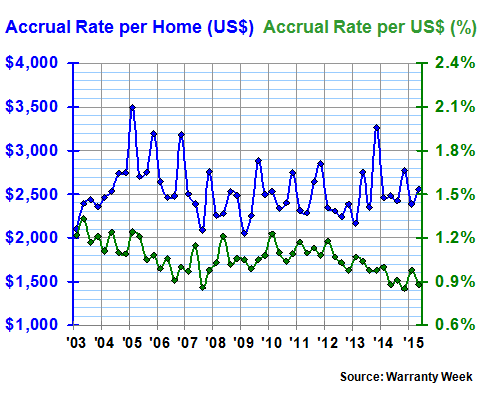
Note the seemingly seasonal fluctuation in the data. There are 50 quarters in the 12-1/2 years from the beginning of 2003 to the middle of 2015, and it looks like the accruals made per home always rise in the fourth quarter. Sometimes, as in 2005 and 2013, there are two humps in the year. Other times, as in 2008 and 2014, the one hump isn't so big.
It just goes to show how arbitrary the accrual amounts really are. Companies say they are setting aside a fixed amount per unit sold, but in the winter when sales slow, accruals evidently don't slow as much, so the average per unit rises. If it really was a fixed amount of accruals set aside per unit sold, the blue line in Figure 1 would be nearly flat.
But also notice how the accrual rate per home sold (blue line) remains close to its $2,500 average while the accrual rate as a percentage of revenue (green line) seems to decline from 2012 to 2015. We think this is simply a sign that home prices are rising: the amount of warranty work expected isn't changing, but sales revenue is, so the percentage derived from dividing one by the other is falling.
Home Sales Metrics
We should explain exactly what metrics we're using. In the chart above, we're tracking warranty accruals, as both a percentage of revenue and as an amount per home sold. The percentage rate, in green, is calculated by taking the amount of accruals each company reports in its financial statements and dividing it by the amount of revenue raised over the same period from home sales (no land sales, no mortgage or finance revenue, etc.).
The dollar amount per unit is calculated by dividing accruals by the number of units sold. And in the homebuilding industry, that usually means the number of homes sold or delivered. It's not the number of housing starts, or the number of homes completed. Just because a home is completed doesn't mean it's sold. And there would be no accruals until it is sold. Therefore, in order to make the closest possible correlation between the sales and warranty data, we're looking for the number of homes actually sold.
It turns out that each homebuilder uses a slightly different term for this metric, however. D.R. Horton Inc., Shea Homes LP, and Meritage Homes Corp. call them "homes closed." William Lyon Homes refers to the "number of homes closed." PulteGroup Inc., Beazer Homes, and the Ryland Group Inc. simply call them "closings."
Meanwhile, KB Home, Hovnanian Enterprises, and M/I Homes Inc. call them "homes delivered." Lennar Corp. refers to "deliveries." Standard Pacific Corp. counts "new homes delivered." MDC Holdings Inc. now calls them "new home deliveries," though it used to refer to "homes closed" until it switched to the new term in 2011. And NVR Inc. simply calls them "settlements."
The most important thing to remember is that not all homes are the same. Some are basic starter homes and others are luxurious mini-mansions. A company that accrues 2% for a $200,000 home is setting much less aside than a company that accrues 1% for a $900,000 home. And the accrual isn't really based on the selling price anyway. It's based on the company's best estimate of future warranty costs over the life of the home's warranty.
There are some 59 different U.S.-based companies that contributed their data to the results in Figure 1 over the past 50 quarters. Together they represent about 20% to 25% of all the single-family homes built in the U.S. since 2003. The rest of the industry is either privately-held or in too much financial chaos to be able to file an annual report.
Accruals per Builder
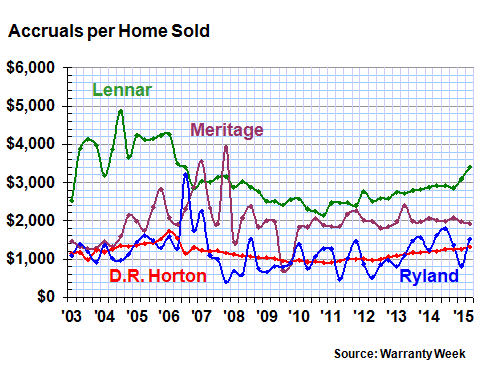
In Figures 2 through 5, we are going to provide accrual trend lines for 15 of the largest builders, updating charts we last published in the July 24, 2014 newsletter. In terms of home sales revenue, new homes sold, and warranty accruals made, the largest builder in our group is Lennar, followed by PulteGroup, and then NVR. However, Ryland and Standard Pacific are merging, so there may be a new company in third place a year from now. But it's very hard to predict. Some of these companies, such as Toll Brothers and D.R. Horton, are now growing at rates of more than 30% a year.
In Figure 2, we can see that Lennar, the market leader, is also one of the best at the financial aspects of warranty management. Over the long term, almost without fail, the company is setting aside about $3,000 every time it sells a home, and it's not changing that amount by much from one quarter to the next. Notably, it also dealt in the past with unexpected moisture and drywall issues with changes of estimate, rather than by modifying its accrual rate.
However, the company with ice in its veins -- the company that has displayed the most remarkable consistency over the past 50 quarters, is D.R. Horton. Sales can rise and sales can fall, but D.R. Horton is going to set aside $1,150 in warranty accruals every time it sells a home. In the chart below, D.R. Horton is like a skewer through the shish kebabs of Ryland.
Figure 2
New Home Builders
Accruals Made per Unit Sold
(in US Dollars, 2003-2015)
The amount of warranty accruals is of course based on the predicted need for warranty work. And the cost of warranty work is based upon the number of incidents times the average cost per incident. In turn, the cost per incident is based upon not only labor rates, but also the cost of materials.
Warranty Management Experts
The point is, D.R. Horton and Lennar are proof that there really is a stable correlation between the number of homes sold and the amount of accruals made. In other words, the amount of accruals per home sold, while it isn't constant, isn't constantly changing. These companies are experts at the financial aspects of warranty management. And that makes us question the reasoning behind some of the chaos in these next few charts.
In Figure 3, we can see both the rising accrual rate of KB Home and the declining accrual rate of M.D.C. Holdings. But we can also see the chaos in the data that's caused by them accruing $5,000 per home sold in some periods, and $1,000 per home at other times.
In fact, at one point late in fiscal 2007, KB Home accrued exactly $0 -- no money per home sold. That happened to be at the tail end of a fiscal year in which the company declared a $12 net loss per share and saw homebuilding revenue decline more than 30%. In other words, we doubt accruals stopped because all the houses they sold were perfect.
Figure 3
New Home Builders
Accruals Made per Unit Sold
(in US Dollars, 2003-2015)
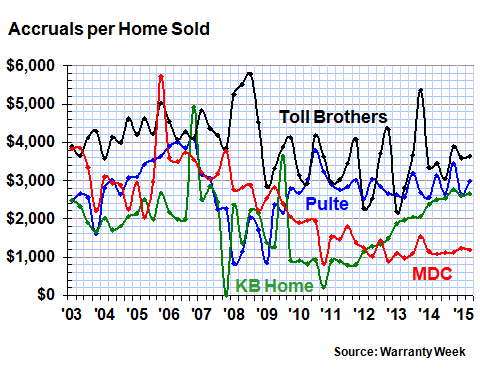
Toll Brothers is selling luxury homes, so it's no surprise to see them setting aside more per home than most of their competitors. But it is also a good example of the seasonal variation in accruals per home. We're not including each company's accrual rate as a percentage of revenue, but Toll Brothers is consistently close to 0.6%, which a glance back to Figure 1 will suggest is somewhat below the industry average (green line).
Therefore, what we're saying is that with luxury homes, because of their high selling price, it is possible to be above average with one warranty metric and below average with the other. Toll Brothers is setting aside an above-average amount of $3,900 per home sold, but that's only a below-average 0.6% of its sales revenue, because it's a luxury home builder.
Extreme Accrual Rate Swings
In Figure 4 the peaks and valleys are even more extreme. Beazer Homes once accrued nearly $54 million in a quarter in which it sold only 3,600 homes, so its accrual rate per home was an astonishing $15,000. And in three different quarters, it made no warranty accruals at all.
Hovnanian twice set aside more than $10,000 per home sold and once set aside $15,500 per home sold. And in the second quarter of fiscal 2015 ended April 30, its accrual rate rose above $7,700 per home sold as its claims cost rose more than six-fold to $30.5 million, thanks primarily to the settlement of a class action lawsuit in New Jersey.
NVR, though it never went over the $10,000 mark per home sold, came awfully close to doing so during two of the four quarters of 2013. More recently, it has accrued about $3,500 per unit sold, which because of past volatility is somewhat below its long-term average.
Figure 4
New Home Builders
Accruals Made per Unit Sold
(in US Dollars, 2003-2015)
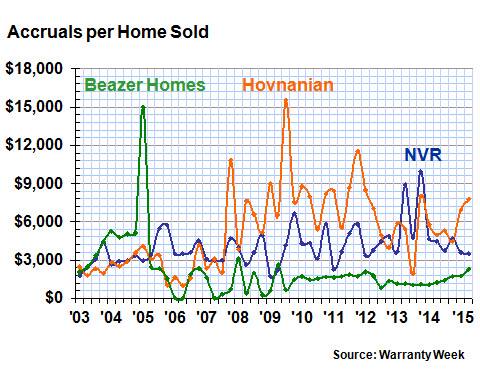
Incredibly, the accrual rate per home sold by Beazer Homes is somewhat below the industry's long-term average. But in a positive light, its accrual rate per home sold since 2010 has displayed an almost Horton-like consistency, never straying far from the $1,500-per-home level. Like Lennar, Meritage, M.D.C. and others, the company seems to be gaining an expertise in the financial aspects of warranty management as time goes by.
Gaining Expertise Over Time
What we mean by this statement can be seen more clearly in the track record of M/I Homes, as depicted in Figure 5 below. In 2003 and 2004 -- the dark ages of warranty management -- it accrued anywhere from $470 to $4,400 per home sold, sometimes swinging from one extreme to the other in consecutive quarters. But then in 2005 came stability, and flat lines. In the past 38 quarters it has remained very close to its post-2005 accrual average of $2,200 per unit sold.
Figure 5
New Home Builders
Accruals Made per Unit Sold
(in US Dollars, 2003-2015)
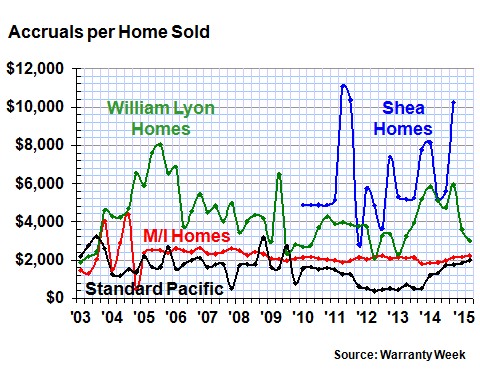
Shea Homes, we should note, is a limited partnership that didn't begin including warranty data in its financial statements until 2010. And it ceased filing its financial reports with the U.S. Securities and Exchange Commission earlier this year, when it redeemed the last of its publicly-traded bonds. So there are only 20 quarters of data for the company in Figure 5. All of the 14 others have reported 50 quarters of data.
We should also note that unit sales figures for these 15 companies have risen year-over-year for the past 14 consecutive quarters. Unit sales began falling in early 2006, but stopped falling in late 2011. So, for what it's worth, this is the middle of the fourth year of increasing unit sales.
Industry Averages
Overall, since 2003, the industry averages have been $2,500 per unit sold and 1.1% of sales revenue. Those are the industry benchmarks. Of the 15 companies we're spotlighting in these charts, eight are below average for accruals per home sold, while seven are above. Those below average include D.R. Horton, Ryland, Standard Pacific, KB Home, Meritage, Beazer, M/I Homes, and M.D.C. Holdings.
The other seven are above the $2,500 average, and Hovnanian and Shea Homes have the highest averages of all, at $5,300 and $6,200 per home sold, respectively. As we mentioned, Toll Brothers is also above average with this metric, but is below average when accruals are measured against revenue, because of the relatively high price of the homes it builds. Shea Homes and Hovnanian are also above average when the accrual rate is measured as a percent of revenue.
PulteGroup also follows the same over-under pattern as Toll Brothers, though to a lesser extent. Its accrual rate per home is slightly higher than average at $2,775. But its accrual rate as compared to revenue is slightly below the industry average at 0.9%. However, the company's average selling price in 2014 was $329,000, which is well below the Toll Brothers average.
D.R. Horton, the industry stalwart in terms of accruals per home, is also extremely dependable in terms of accruals per dollar of revenue. Its long-term average accrual rates have remained consistently close to $1,150 and 0.5%, both of which are also significantly below average. Also well below average are Ryland and Standard Pacific, which is a good sign as they prepare to merge.
But again, these metrics depend heavily upon the price of the homes sold. And accruals are also affected by climate and location, as we've seen with the mold and drywall problems many builders have faced. So perhaps it would be best to merely compare the shape of each of these company's lines, with Horton-like flatness and consistency over time being the ideal, no matter what the dollar amount.


