

Auto Warranties & Quality Ratings:
Few people would say that Chinese cars are the best in the world and that German cars are the worst. The quality and reliability studies certainly say otherwise. But the warranty data says Chinese companies spend the least and German companies pay the most. How to reconcile these contradictory data sets?
In last week's newsletter we said there seemed to be no correlation between warranty expense rates and vehicle quality or reliability ratings. We said that even though German cars had the highest expense rates and Chinese cars the lowest, that did not mean that Chinese cars were the best, nor German cars the worst.
This week, we're going to flesh that statement out a bit, by citing some of those quality and reliability statistics, and comparing them to what the warranty expense data says. Let's start with J.D. Power, which for 50 years has been polling new car owners to find out how they fared. Each year, J.D. Power a study of the problems experienced by original vehicle owners during the first 90 days of ownership. The Initial Quality Study then ranks the car brands based on the by the number of problems experienced per 100 vehicles, with a lower score reflecting higher quality. Because we're using 2017 warranty data in Figures 2 and 3 below, we took a look at the results of the 2017 U.S. Initial Quality Study.
Quality By Region
J.D. Power helpfully included a graphic in that study which organized the nameplates by headquarters country, as we did with our data. As can be seen below, in the last five years the number of incidents per 100 is down for all four regions: Europe, Japan, U.S., and South Korea. In this case, the lower the number, the better.
Figure 1
J.D. Power
2017 U.S. Initial Quality Study
(results by country, 2013-2017)
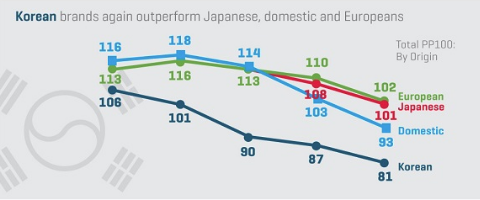
Because few Chinese cars are sold to U.S. buyers, there was no data included for Chinese brands. And, of course, the European data also includes Fiat, Renault, PSA and Volvo, so it doesn't match up exactly to our German-only data. Because J.D. Power included Korea, we created a new set of statistics on average warranty expense rates for Hyundai and Kia.
Contradictory Warranty Data?
The problem is, we can't find any evidence of this decline in our charts, which are based on the reports of the manufacturers themselves with some estimates added for non-reporters. Looking just at claims rates, we see that Germany is spiking in 2017, Korea is rising, and Japan is just a bit below 2016's peak (we're time-shifting the Japanese fiscal year which ran from April 2016 to March 2017 to calendar 2016). The U.S. has remained relatively steady for the past three years, and China remains unusually low for the entire decade.
Figure 2
Worldwide Automakers by Country
Average Warranty Claims Rates
(as a % of product sales, 2008-2017)
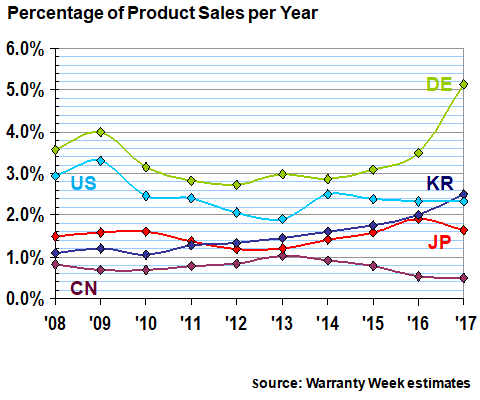
The claims rate for vehicle manufacturers based in China has averaged only 0.8% for the past 10 years. The claims rate for Japan has averaged 1.5%, and the average claims rate for Korea is just a notch above 1.5%. The U.S. average claims rate is just below 2.5%, and the decade-long average claims rate for vehicle manufacturers based in Germany is 3.4%.
Germany and Korea also have a higher standard deviation than the other three, which is caused by the recent rises. The standard deviation for China and Japan is lowest, which reflects the relative stability of their claims rates over the past decade.
Average Warranty Accrual Rates
In Figure 3, we're looking at the accrual rates of the automakers based in the five countries. Once again, China is the lowest and Germany is the highest. However, with this metric the decade-long average for Japan is slightly above 1.8% while the average for Korea is slightly below 1.8%. The U.S. is at 2.1%, and Germany is at 4.2%.
Figure 3
Worldwide Automakers by Country
Average Warranty Accrual Rates
(as a % of product sales, 2008-2017)
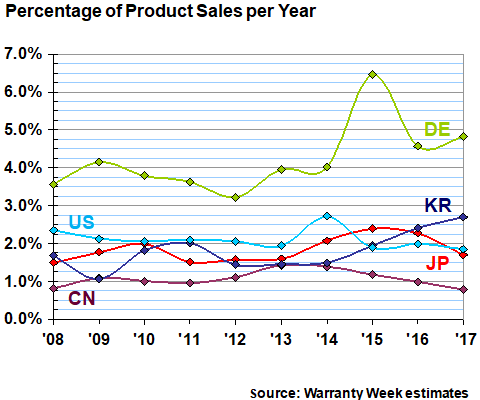
Once again, Germany and Korea have the highest standard deviations, caused by the recent increases. China and the U.S. have the lowest standard deviations, reflecting the relative stability of their accrual rates over time.
However, the only country that seems to have warranty data with a downward slope as is found in Figure 1 is China, and J.D. Power didn't include China. Therefore, once again with warranty accrual data, we cannot find any evidence of a decline to match the reported decrease in problems per 100 vehicles.
Most Reliable Cars
Now, let's turn to a slightly different metric, collected by a consumer magazine from its readers. On October 24, Consumer Reports published an article entitled, "Who Makes the Most Reliable Cars?" From the looks of the data in the table below, the answer is the Japanese, followed by the Koreans and Germans. And though the question isn't asked, the answer for anyone wondering who's at the bottom of the chart is, it's primarily the American brands.
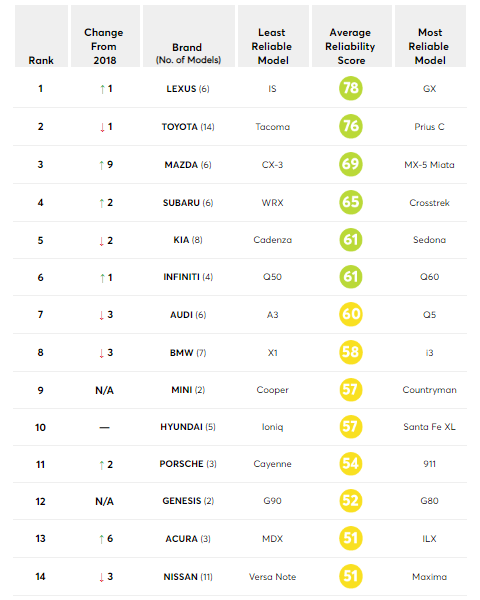
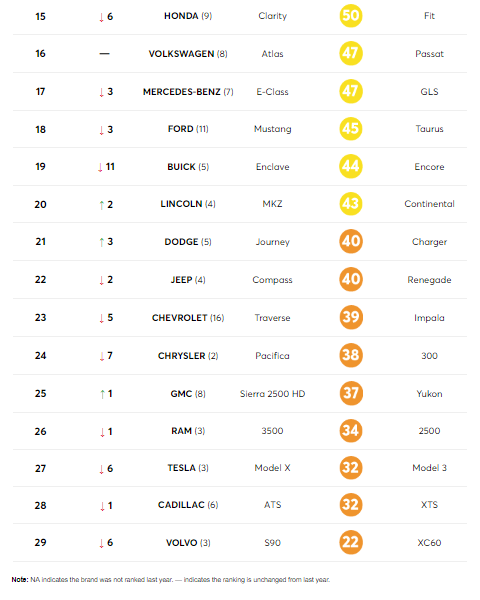
For its survey results, Consumer Reports collected data from some 500,000 readers. In this case, the higher the number, the better. Once again, the data is collected from U.S. car buyers, so Chinese models are largely absent from the results. Also, Consumer Reports treats Jeep, Dodge, and Chrysler as domestic U.S. brands, and counts Audi and Mini separately from VW and BMW. Our warranty data is for each entire parent company on a worldwide basis, so we can't get down to the brand level.
However, what the Consumer Reports data suggests is that the companies based in Japan, Korea, and Germany make the most reliable cars. Our warranty data suggests that if that's true, then the Germans are less efficient in terms of warranty expenses, because they pay more for comparable levels of reliability.
So far, nobody has come up with an answer to why the China-based manufacturers always have the lowest warranty costs, except for one reader who said it's probably because their accounting principles are ... shall we say less stringent? Or maybe they do make the best cars in the world? Or maybe they do have the most efficient warranty processes in the world? Inquiring minds want to know.
European Reliability Metrics
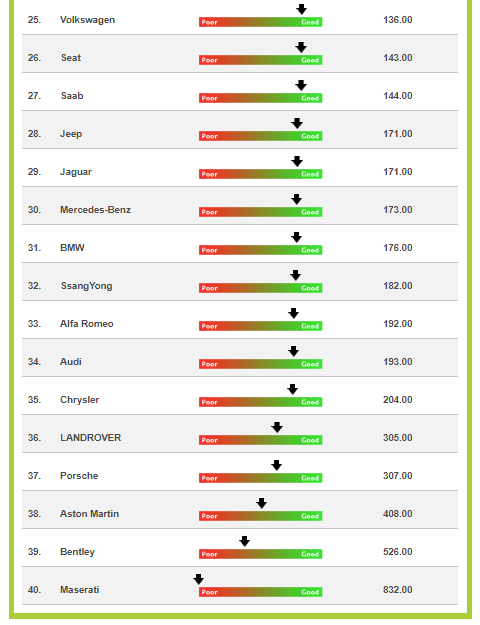
Finally, Warranty Direct Ltd., a British administrator of vehicle service contracts, maintains its own manufacturer reliability database, which is based on the real-world claims records of its 50,000 VSC policy holders. Once again, the Japanese take up many of the top slots, but a variety of European luxury and sports brands are at the bottom of this chart.
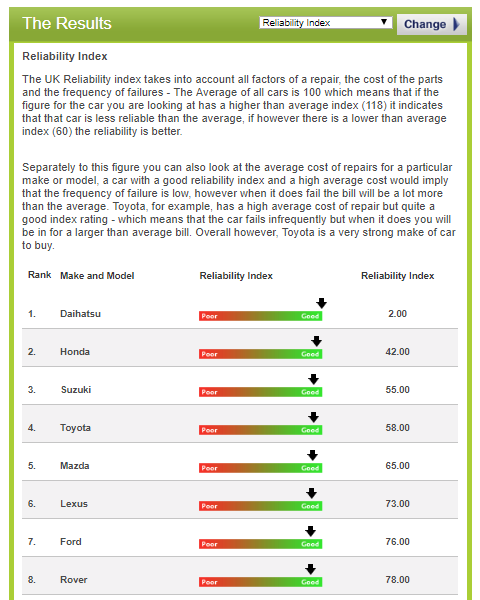
Daihatsu, the most reliable brand on the chart, is a reference to Daihatsu Motor Company Ltd., which is now owned by Toyota. Ironically, sales of Daihatsu models have now ceased in Europe, but their legend apparently lives on.
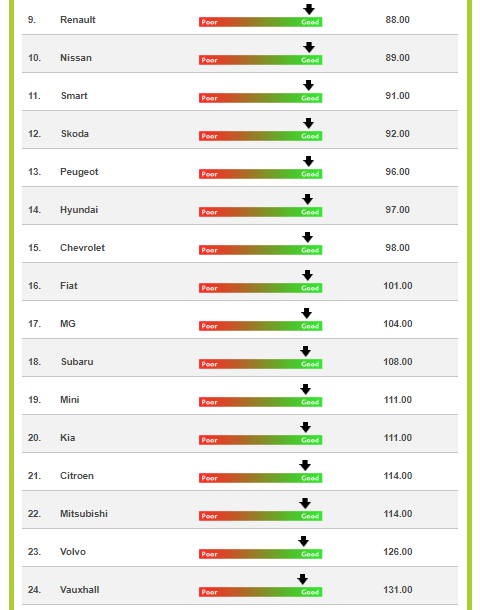
The only remotely Chinese brands on the list are MG and Volvo Cars. MG Motor UK Ltd., the venerable British racing car manufacturer descended from Morris Garages, is actually now a subsidiary of the Shanghai-based SAIC Motor Corp. Ltd. And Volvo Cars is now owned by the Zhejiang Geely Holding Group Company Ltd., better known as Geely, which is based southwest of Shanghai.
Korea In The Middle?
Hyundai, at 14th, and Kia, at 20th, are in this case in the middle of the pack, rather than at the top, as they were in the J.D. Power and Consumer Reports surveys. By the way, SsangYong, listed 32nd out of 40, is a reference to another Korean manufacturer called SsangYong Motor Company, which is majority-owned by a conglomerate called Mahindra & Mahindra Ltd., which is based in Mumbai, India.
We don't have good enough warranty data for the French brands to allow a reliable comparison with the other countries. However, we note that in this Warranty Direct chart, Renault is ahead of Nissan, and Peugeot is ahead of Hyundai. Citroen is just behind Kia.
It just goes to show that, as we said, there's apparently no correlation between warranty expense rates and quality or reliability ratings. We suspect that part of the reason is what is being measured. Incidents per 100 vehicles might correlate to the number of claims, but it says nothing about the average cost per claim. Magazine surveys depend on the emotions of readers who participate.
The Warranty Direct index seems to account for both the frequency and severity of repair costs, so it should be analogous to warranty costs as a percentage of revenue. In fact, it states, "Toyota, for example, has a high average cost of repair but quite a good index rating -- which means that the car fails infrequently but when it does you will be in for a larger than average repair bill."
However, extended warranty providers typically see cars at a different age than the initial period when they're covered by their factory warranties. And, no insult to the quality of British roads, but European drivers are not using their vehicles with the same frequency or severity as Americans do. And the British are able to buy numerous brands, especially sports models, that don't have a large U.S. presence. So even the repair indexes of U.S.-based VSC administrators, if they were ever published, would probably be very different from top to bottom.
Overall, the lack of a consensus among these various data sets supports the idea that there is no simple correlation between high levels of warranty cost and low quality or reliability. Low warranty costs do not always imply high product quality. When it comes to warranty costs, wome companies are more efficient than others, even if they have similar reliability ratings. What makes more sense is to measure the long-term average and then look for major deviations from that baseline, which suggest improving or deteriorating conditions.


