Solar Cell Quality Trends:
Demand is rising and prices are falling, yet most manufacturers have managed to increase product quality in recent years. That is, except for the U.S.-based producers, who come in last in a testing lab's new white paper.
The Photovoltaic-Institute Berlin AG, which provides inspection and consulting services to solar cell manufacturers, has published a white paper on worldwide product quality trends in the industry.
The white paper, "Industry Trends in PV Module Quality," analyzes trends in PV module quality from over 250 independent factory audits conducted on more than 120 manufacturers by the company since 2012.
Over its seven pages, the white paper makes the case that despite soaring demand and plummeting prices, product quality levels in the solar panel industry have generally been rising -- except, that is, among manufacturers based in the U.S. and Mexico.
Falling Prices
In its white paper, PI Berlin says the price per watt of solar power has dropped by 70% from 2012 to 2018, allowing large projects to get larger for the same cost, and allowing single-household projects to be done cheaper. The following chart, sourced to RS Energy, shows how prices have fallen during the past seven years.
Figure 1
Solar Module Price per Watt
(in US$ per Watt, 2011-2018)
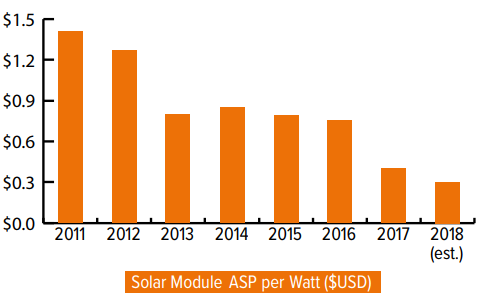
The price of an average household system, including all equipment and labor, is likely to be much higher than 30 cents per watt, however. In fact, in the current market, a typical 6 kilowatt system would cost around $18,000 installed, before tax credits. According to the online price quote service EnergySage, however, that pricetag has fallen by 6.5% in just the past year. And that supports the pricing trend suggested by PI Berlin in its white paper.
Meanwhile, a typical U.S. household uses about a thousand kilowatt-hours per month, and spends around $120 per month on its electric bill. So the typical solar system would pay for itself after 12.5 years -- or up to three years faster if additional tax deductions or other subsidies are available to offset costs.
Solar power plants are built on an entirely different scale. First there are construction costs and then there are ongoing operating costs. Of course, the product produced by the plants is electricity, measured in terms of megawatt-hours or even gigawatt-hours but whose product is still sold to residential and commercial customers in units of kilowatt-hours.
The New York State Energy Research and Development Authority, for instance, just announced its intent to build over 1,654 megawatts of new solar power plants in 16 new projects, able to generate over 3,800,000 megawatt-hours of energy per year. All of the projects are expected to be in operation by 2022. The largest is the 280 megawatt solar facility planned for the Excelsior Energy Center in the Finger Lakes region.
Amortized over the 20-year life of the projects, the cost of construction is expected to be around $18.77 per megawatt hour, according to the government's projections. That's less than two cents per kilowatt-hour, and is down around 14% from the last cycle of solar project bids a year ago.
Electricity in New York state now costs an average of 19 cents per kilowatt-hour, which is much higher than the national average, according to the U.S. Bureau of Labor Statistics. Even given a healthy markup and some hefty operating costs, the price of a kilowatt-hour of new solar production could come in much lower than those currently prevailing rates.
Already, alternative energy service companies in the state are offering "green energy" contracts priced as low as 7.7 cents per kilowatt-hour. And it could fall further, as more wind and solar capacity comes online.
Quality Ratings
Meanwhile, the product keeps getting better. A series of charts demonstrates that larger manufacturers have typically demonstrated better and more consistent quality than smaller manufacturers, and that competition and ever-increasing customer demands have generally been pushing quality levels higher over time.
In Figure 2 below, PI Berlin organizes its quality ratings by the annual output of each manufacturer. Large manufacturers, which produce in excess of 3 gigawatts of product per year, are all rated average, above average, or good, while half the small manufacturers, which produce less than 500 megawatts of product per year, are rated below average or poor.
Figure 2
Quality Grades vs. Factory Size
Based on 2017 Audit Grades
(annual production in gigawatts)
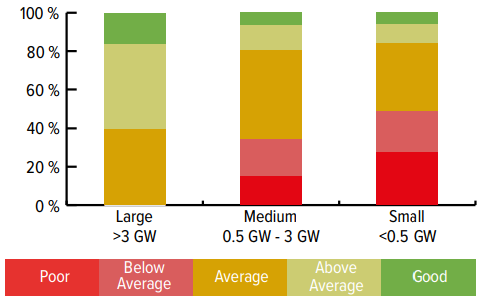
PI Berlin also notes that the larger customers tend to source their materials from the larger manufacturers, so their insistence on high levels of quality in the products they buy causes the manufacturers to provide it.
"The cost advantages that larger manufacturers can leverage due to the scale of operation allows them to upgrade factories with higher levels of automation, acquire better materials at lower prices as well as attract and retain higher qualified staff," the white paper notes.
Annual Changes
PI Berlin also measured the annual changes in quality ratings, noting, for instance, that from 2015 to 2016, and again from 2016 to 2017, around half of the manufacturers it audited achieved better ratings than they did the year before.
"Competition and ever-increasing customer demands on quality have generally been pushing improved quality," the white paper suggests. Figure 3 illustrates this trend.
Figure 3
Annual Changes in Quality Grades
Percentage Up, Down, or No Change
(2014 to 2018)
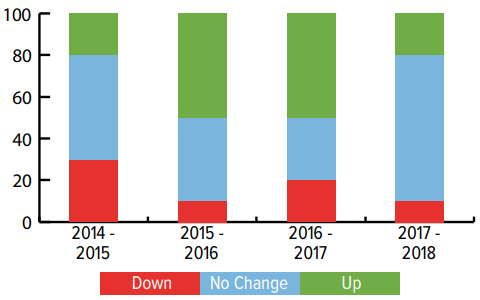
Note that in 2018, only about 20% of the manufacturers achieved higher quality ratings than they did in 2017, while about 70% saw no change. However, also note that only a small number of manufacturers -- never more than 30% of the total -- saw their ratings go down in any given year.
The bad news is that when PI Berlin organizes its manufacturer ratings by geography, those located in the U.S. and Mexico come in dead last. As can be seen in the chart below, the quality levels of half the manufacturers located in those two countries were rated below average or poor. No other region had any manufacturers rated poor, and none of the manufacturers located in South Korea or Southeast Asia were even rated below average.
Figure 4
Percentage of Manufacturers Given Each Quality Grade
Of 20 to 40 Companies Rated per Year
(2014 to 2017)
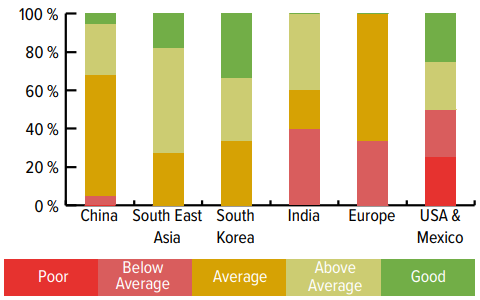
"Since 2011, PI Berlin has conducted audits in 16 countries around the world, enabling a comparison of PV module quality ratings by location of manufacturing," the white paper explains. "In general, manufacturers in China, Southeast Asia and Korea achieved higher quality ratings compared to those in India, Europe, the USA and Mexico.
"The reason for this perhaps counter-intuitive result is that manufacturing in Asia has reached true mass production. This has led to the creation of a complete supply chain ecosystem designed to support production. This includes a wide variety of manufacturing equipment and material vendors.
"This has enabled module manufacturers in these locations to source good quality local materials and equipment at competitive prices, as well as develop a strong skills base in engineers and operators that are needed to run large factories."
Warranty Expense Rates
So let's take a quick look at three American manufacturers. We can't speak to the quality ratings of the individual companies, because there is no publicly-available data about failure rates or replacements. However, warranty expense rates could serve as a proxy, given that they measure the percentage of revenue going towards repairs and replacements over time.
SunPower Corp., based in San Jose, has been in business since 1985. It has been reporting its warranty expenses since 2004, as can be seen in the chart below. Over the nearly 15 years of available data, its claims and accrual rates have varied over a wide and unpredictable range.
Its claims rate, depicted by the red line in the chart below, has averaged 0.5%, with an ever larger 0.6% standard deviation over that time. Its accrual rate has averaged 1.5%, with an 0.7% standard deviation.
Figure 5
SunPower Corp.
Average Claims & Accrual Rates
(as a % of product sales, 2004-2018)
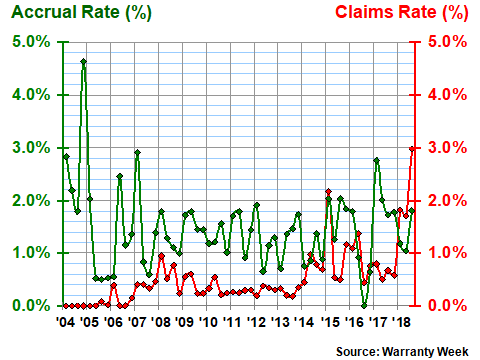
Because solar power systems are designed to last for decades, as evidenced by their very long warranty durations, claims are always slow to develop and accruals are usually greater than claims. In addition, because of quickly-rising sales volumes, the cost of claims arising from old systems compared against However, as the recent upturn in SunPower's claims rate suggests, when they finally do develop, they can rise to significant levels.
First Solar Inc., based in Tempe, Arizona, saw its claims rate spike to nearly three percent back in 2012. In business since 1990, the company has spent an average of 0.5% of its product revenue on warranty claims since its reporting began in 2005. But that claims rate comes with a high degree of volatility, with a standard deviation as high as the average. Its accrual rate, meanwhile, is higher but more stable, with an average of 1.0% and a standard deviation of 0.3%.
Figure 6
First Solar Inc.
Average Claims & Accrual Rates
(as a % of product sales, 2005-2018)
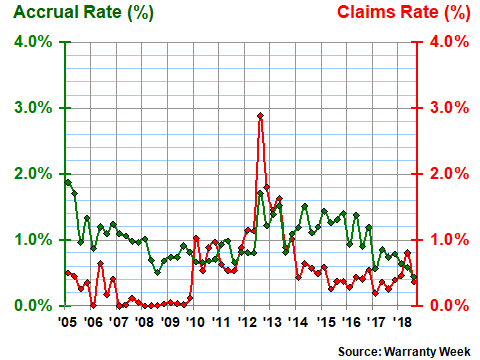
In recent years, First Solar's accrual rate has been declining while its claims rate has remained relatively stable. If one were to frame this trend in the format that PI Berlin used in its white paper, then First Solar would likely be among the manufacturers with stable or rising quality ratings from one year to the next.
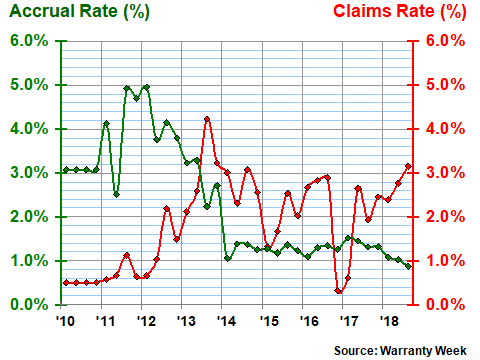
Lastly, Enphase Energy Inc., headquartered in Fremont, California, has since 2008 been manufacturing the inverters that are necessary to turn the direct current generated by solar panels into the alternating current used by electrical customers. It began reporting its warranty expenses in 2010.
As can be seen in the chart below, its claims rate has been higher than its accrual rate for most of that time. However, the way the math works out, its claims rate has averaged 1.0% while its accrual rate has averaged 2.3%. The standard deviation on its claims rate is 1.0%, while it's 1.3% for the accrual rate.
Figure 7
Enphase Energy Inc.
Average Claims & Accrual Rates
(as a % of product sales, 2010-2018)
It would be difficult to compare these three American manufacturers to their peers located in Europe and Asia. First, outside of the U.S., and outside of the automotive industry, very few manufacturers based outside the United States actually report their warranty expenses to shareholders. Second, almost all that do so report those expenses only once a year. So there would be only 14 or 15 data points instead of 60 or more, and that in and of itself would make the charts look less volatile.
However, for the purposes of comparison, we want to quickly summarize the warranty expense rates of three solar equipment manufacturers based outside the U.S. Canadian Solar Inc., based near Toronto, has since 2004 been averaging a claims rate of 0.1% and an accrual rate of 0.8%.
Meanwhile, the standard deviation of its claims rate has been 0.2% over that same time period, while the standard deviation of its accrual rate has been 0.3%. Therefore, while its expense rates have generally been lower than the examples above, the company's warranty metrics share a pattern of instability with its American peers.
Asian Manufacturers
Yingli Green Energy Holding Co. Ltd., based in China near Beijing, has been reporting its warranty expenses since 2005. Its claims rate has averaged 0.2%, with an equally large 0.2% standard deviation. Its accrual rate has averaged 1.0%, with a standard deviation of only 0.1%.
Hanwha Q Cells Co. Ltd., based in Seoul, South Korea, has been reporting its warranty expenses since 2009. Over that time period, its claims rate has averaged 0.5%, with a standard deviation of 0.4%. Its accrual rate has averaged 1.0%, also with a standard deviation of 0.4%.
With both expense rates, Canadian Solar and Yingli have kept their claims and accruals lower as a percentage of sales revenue than any of the U.S.-based manufacturers. All three non-U.S. manufacturers have a lower average accrual rate than their U.S.-based peers. However, First Solar has a claims rate just slightly lower than Hanwha's, which prevents us from saying that the warranty expense rates of the three non-U.S.-based companies are always lower than those of their U.S.-based peers.
Again, warranty expense reports are generally not available for solar power equipment manufacturers based outside the U.S. So these spot comparisons are nowhere near as extensive as the 250 factory audits conducted by PI Berlin for more than 120 manufacturers since 2012. However, they do not contradict the company's findings either.