

Supplier Recovery Estimates:
While automotive parts suppliers pay roughly 10% of the industry's warranty expenses now, their "fair share" could be as high as 37%. But there's no way to get them to pay that much, so supplier recovery efforts are stuck in a contentious standoff between the OEMs and their suppliers.
In a perfect world, whichever automotive manufacturer in the supply chain was found to be responsible for the failure of a new vehicle would pay their "fair share" of the warranty costs associated with its repair or replacement. But the world isn't perfect, so some suppliers are paying for no-trouble-found parts returns while others are evading responsibility for the failures they caused.
In round numbers, automotive suppliers are paying roughly a tenth of the industry's warranty costs, while their share of sales revenue exceeds a third. That's the gap between what they're paying and what they should pay. But before we make that jump to conclusions, first we have to measure the current state of affairs between the automotive OEMs and their suppliers.
In this newsletter we propose to lay out three different ways to measure the relative warranty costs of the OEMs and their suppliers. First, we will look at each group's share of net claims payments. Second, we will compare the size of their warranty accruals to their sales data. And third, we will measure the gap between their respective average claims and accrual rates.
Before we get started, we have to acknowledge the limits of the analysis below. The automotive business is global, while this analysis is for a single country. When we look at only U.S.-based manufacturers, we are excluding the output of not only all the Chrysler and Jeep plants (owned by a European parent), as well as the output of all the U.S.-based factories of Volkswagen, BMW, Hyundai, Toyota, and Honda, among others. We are also excluding the American production of important non-American suppliers such as Magna International, Autoliv, Robert Bosch, and others.
And, of course, we have to include all the products made in Europe, Asia, and elsewhere by American companies such as GM and Ford, as well as the exports of dozens more, because each company provides us with only one worldwide set of expense totals for all their products in all their markets. In other words, we are on the one hand excluding quite a bit of U.S.-based production by foreign firms, and on the other hand we are including the foreign sales of U.S.-based manufacturers. And we haven't said anything about all the cross-border activities occurring along the Mexican and Canadian borders.
At the same time, we are suggesting that the warranty payment system is a zero-sum game. The customer brings their vehicle back to the dealer for warranty work. The dealer makes a claim to the OEM. The OEM pays the dealer, and looks for reimbursements from their suppliers, if possible. And then the OEM reports the net amount paid for that warranty work: claims payments minus reimbursements. Therefore, if we know the net costs of both the OEMs and the suppliers, we know the total costs within the system.
Quarterly Claims Payments
In Figure 1 we are repeating some of the data already detailed in the past two newsletters, namely, the claims payments reported by 50 U.S.-based automotive OEMs and 120 of their suppliers. For simplicity, we're combining all the large and small vehicle makers under the single banner of OEM, and we're combining all the powertrain and other suppliers under the single heading of suppliers. Later on, we will once again separate them into four groups.
Note that the data in Figure 1 is in a quarterly format, so there are 64 separate measurements of the net claims payments of the two groups over the past 16 years. And in a quick glance at the data, we can easily spot the recessionary trough from 2009 to 2013, as well as the recall-related spike of 2014.
Figure 1
Automotive Warranties
Claims Paid by U.S.-based Companies
(in US$ millions, 2003-2018)
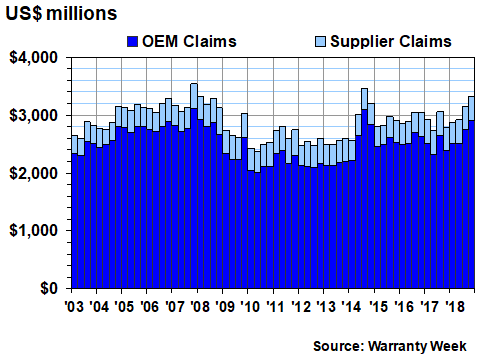
So let's assume the long-term average quarterly claims cost of the U.S.-based auto industry is around $2.9 billion. Lately it's been above that average, but it's also been below that level. But we have 64 separate measurements to work with, and each is backed by the measurements of 170 companies, so there's no need to estimate or approximate.
Percentage of the Total
Now, let's change the view from dollars to percentages. In other words, let's assume that the $3.327 billion in claims payments reported for the fourth quarter of 2018 is equal to 100% of the claims payments of the entire U.S.-based industry. And let's assume that the $3.462 billion reported in the third quarter of 2014 is also equal to 100%, as is the $2.366 billion reported in the second quarter of 2010.
If, in each quarter, the combined total for the OEMs and suppliers equals 100%, what is each of their relative shares? From the data in Figure 1 it looks to be about nine-to-one, but in Figure 2 we're zooming in on the data to show that the ratio has actually varied from 83% to 90% over the past 16 years.
Figure 2
Automotive Warranties
Claims Paid by U.S.-based Companies
(as a percentage of 100%, 2003-2018)
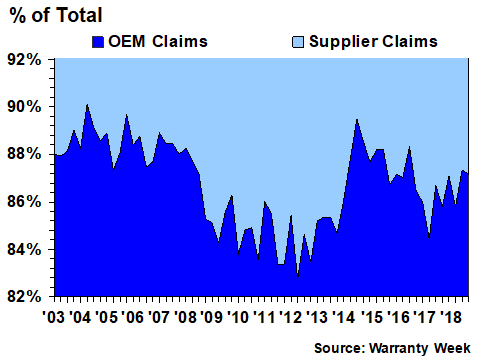
Notice that the ratio was consistently high before the recession, consistently low during the recession, and has been both high and low since the 2014 recall-related spike. We would suggest that this documents the increased post-2008 efforts by the OEMs to recover more reimbursements from their suppliers, the setback these efforts suffered after the 2014 recalls, and finally the back-and-forth between the OEMs and suppliers that has occurred since.
We'll leave it to the suppliers to detail the increased supplier recovery efforts of the OEMs, and we'll leave it to the OEMs to justify those efforts. We just want to measure it. And in Figure 2, we have 64 different data points backed up by the warranty expense reports of 170 different companies.
Sales-Based Measurement
The obvious question is what would be the "right" ratio between the warranty expenses of the OEMs and their suppliers. Some say it's 80-20. Others say it's 70-30. But it's impossible to know for sure, because some portion of those payments made by OEMs to dealers are more like a stipend, especially during the lean years. Plus, there's customer goodwill, the cost of loaner vehicles, and all those free donuts. Also, the state laws related to labor rates and parts cost are perplexing, to say the least. So no supplier is going to willingly pay their "fair share" of an expense that they know includes needless markups.
But there is one measurement that neither the OEMs nor the suppliers can discount. And that is the ratio between the annual revenue of all 50 of these OEMs, and all 120 of their suppliers. A dollar is a dollar, and no OEM is going to pay an inflated cost for parts, nor will any suppliers willingly give them away at a net loss.
In other words, the annual revenue of these companies measures the value they produce, as decided by their customers who pay them. And that cuts through all the mandatory labor rates, unfair parts costs, customer goodwill, no-trouble-found claims, and yes, even the free donuts.
In Figure 3, we're looking at the annual figures for warranty accruals made by the OEMs and their suppliers from 2003 to 2018. As in Figure 1, it once again looks like a nine-to-one ratio between them. And once again, we see the pre-recession heights of the annual totals, the 2009 valley of the recession, and the 2014 spike thanks to the recalls.
Figure 3
Automotive Warranties
Accruals Made by U.S.-based Companies
(in US$ billions, 2003-2018)
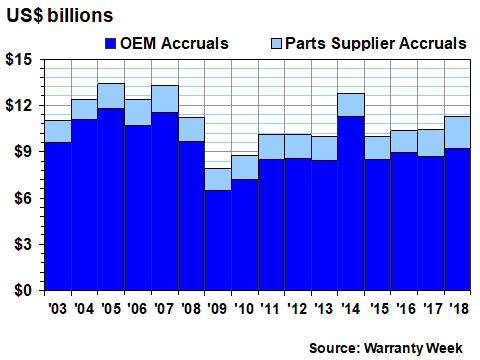
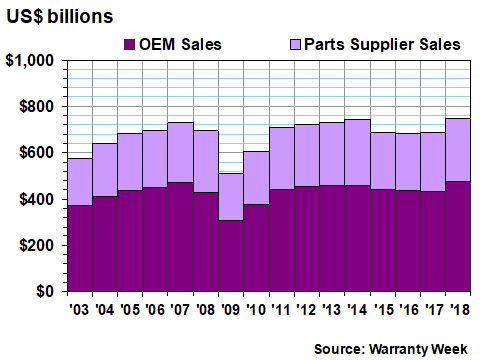
This is the same data as was detailed in the last two newsletters, so there's no need to include the annual totals. You can look them up yourselves. What is new is the data presented in Figure 4. In every industry warranty report, we note that we collect four essential warranty metrics: claims, accruals, reserves, and sales. And we use those sales figures to calculate a pair of ratios for claims as a percent of sales, and accruals as a percent of sales. But we never include a chart for sales. This time we will.
OEM-to-Supplier Sales Ratio
Turns out that for the past 16 years, the annual product sales totals of the U.S.-based OEMs and their supplier have added up to roughly $700 billion, give or take, with 2018 totals setting a new record of $750 million (up 9.3% from 2017). But more importantly for our purposes in this newsletter, the OEM share of sales has ranged from 61% in 2009 to 65% in 2003, and has averaged 63% over the past 16 years. Conversely, the supplier share has ranged from 35% to 39%, and has averaged 37% during that time.
This is readily apparent in Figure 4, where it looks like the OEM share is almost twice as large as the supplier share of product revenue. Once again, there are also Canadian, Asian, and European suppliers not counted here, and some of the U.S.-based suppliers are providing parts to the American factories of Asian and European OEMs. But the ratio between just the U.S.-based companies is roughly two-to-one, and has remained fairly consistent over the past 16 years.
Figure 4
Automotive Warranties
Products Sold by U.S.-based Companies
(in US$ billions, 2003-2018)
What if the suppliers also paid 37% of the claims and made 37% of the accruals? That's unrealistic for a variety of reasons, but we would suggest that this would be the ultimate "fair share," based on the dollar value of their relative contributions to the completed vehicles.
In Figure 2, we showed you that the suppliers are actually paying only 10% to 17% of the industry's net claims in any given quarter. And while we didn't show it, we can also tell you that their exact share of accruals in Figure 3 ranges between 11% in 2004 and 19% in 2018, averaging 15% over the entire period.
Supplier Recovery Gap
So what we've done in Figure 5 is to measure the supplier recovery gap -- the difference between their share of sales revenue and their share of accrual expenses. The supplier share, in light blue, is the same in Figures 3 and 5, but in Figure 5 the OEM share is split in two. The dark purple is the share they should have had based on sales, and the light purple is the share they actually had. In other words, the light purple piece is the gap between the revenue and expense ratios.
Figure 5
Automotive Warranties
Accruals Made by U.S.-based Companies
(in US$ billions, 2003-2018)
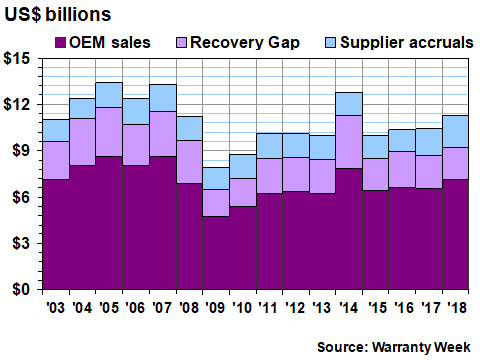
Over the past 16 years, this "recovery gap" has ranged from $1.7 billion in 2009 to $3.4 billion in 2014. On a percentage basis, it has ranged from 18% of the year's total in 2018 to 27% in 2014. And as we've spelled out in previous newsletters, the 2018 extreme is caused primarily by the diesel engine emissions troubles of Cummins Inc., while the 2014 extreme was caused primarily by the ignition switch problems of General Motors Co.
Over the long term, the recovery gap has averaged $2.5 billion in size, or 22% of the industry's warranty accrual total. And yes, that means that suppliers are paying well under half as much as they could be if their warranty expenses were based solely on their share of sales revenue. Good thing they're not!
The Gap in Expense Rates
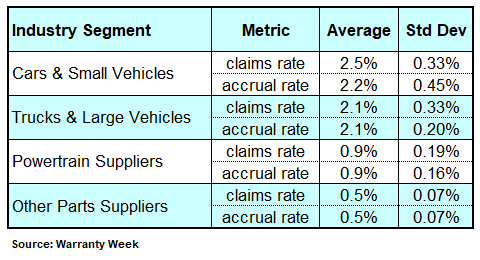
The third way we want to measure the difference between the warranty expense rates of the OEMs and the suppliers is by measuring the gap between their average claims rates and accrual rates. In the past two newsletters, we have included four pair of expense rate charts: for the large vehicle OEMs, the small vehicle OEMs, the powertrain parts suppliers, and the other parts suppliers. In the following two charts, we will present them again, in a slightly different format.
Over the course of the past two newsletters, we have detailed how the small vehicle OEMs seem to have the highest average warranty expense rates, while the other parts suppliers have the lowest. The truck and large vehicle OEMs and the powertrain suppliers were between those extremes. Once again, in percentage rates, those details are:
Figure 6
Automotive Warranties
Average Warranty Claims & Accrual Rates
(as a % of product sales, 2003-2018)
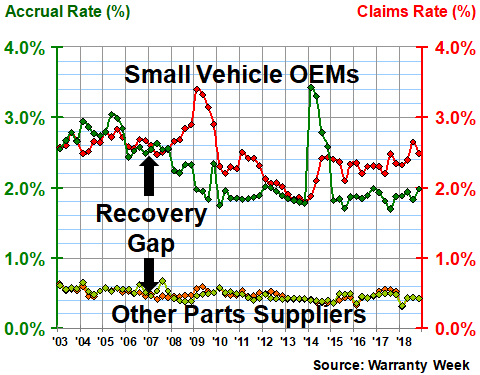
In Figure 7, we're taking the highest and lowest of those four groups, and measuring the gap between them. According to the averages detailed in Figure 6, the gap between the claims rates of the small vehicle OEMs and the other parts suppliers should average around 2.0%, while the gap between their accrual rates should average 1.8%. But over the past 64 quarters, the gap has actually varied in width from 1.2% to 3.0%.
The claims rate gap was at its widest during the depths of the recession, when the sales of the small vehicle OEMs dropped below $220 billion but their claims didn't fall as fast. It was at its narrowest point in 2013, when the OEMs cut their claims rate to its lowest point but the suppliers did not.
The accrual rate gap was at its widest in 2014, when GM had to accrue billions of dollars to pay for its ignition switch recalls, and that caused the small vehicle OEM accrual rate to soar. That gap was at its narrowest point in early 2010, when the OEM accrual rate slipped under 1.8% and the supplier accrual rate rose to nearly 0.6%.
Figure 7
Automotive OEMs & Parts Suppliers
Average Warranty Claims & Accrual Rates
(as a % of product sales, 2003-2018)
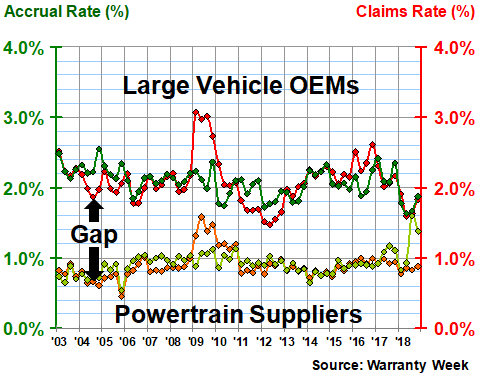
In Figure 8, we're comparing the claims and accrual rates of the large vehicle OEMs and the powertrain suppliers. In the truck, bus, and recreational vehicle industries, it is common for the customer to buy the vehicle, its engine, and its transmission separately from different manufacturers, each providing their own warranty. This has the effect of reducing the expense rates for the OEMs, and raising them for the powertrain suppliers, thereby narrowing the gap between them.
And indeed, what we see in Figure 8 is that the gap never exceeds 1.8%, and in the summer of 2018 they nearly met. The claims rate gap was widest during the recession, when OEM sales dove but claims didn't. And it was narrowest when Cummins first began to deal with the costs of its emissions test failures last year by raising its accrual rate. Over the long term, however, it's averaged 1.2%.
Figure 8
Large Vehicle Makers & Powertrain Suppliers
Average Warranty Claims & Accrual Rates
(as a % of product sales, 2003-2018)
So we've measured the relative warranty expenses of the OEMs and their suppliers in three different ways. First, we looked at their relative share of claims, and found the OEMs paying between 83% and 90% of the industry total. Next, we compared accruals and sales, and found that the suppliers could be paying more than twice as much, if the same accrual rate were applied equally to their sales totals. And finally we looked at the gap between their expense rates, and found it ranges all the way from 0.1% to 2.8%, depending on the timing of the measurement.
In approximate terms, the suppliers pay roughly 10% to 15% of the industry's total warranty costs. But we still haven't answered the one basic question: how high could it go, if supplier recovery efforts were completely 100% efficient, if there were no lawyers, no negotiated settlements, and no impediments to face? Could it ever get all the way up to 37%?
The simple answer is no, it could not. There just far too many no-trouble-found claims in the industry, where essentially the OEMs are paying the dealers to replace perfectly good parts. And the OEMs are also left holding the bag when it comes to goodwill/fraud, where the vehicle may not have qualified for warranty work, or the warranty work was unnecessary or fictional, yet the warranty claim was paid. And why should the suppliers pay inflated prices for parts just because the law says that's what the OEMs should pay to their dealers for warranty work?
In short, the truly 100% efficient distribution of warranty costs is likely between 10% and 37% for the suppliers, and between 63% and 90% for the OEMs. Exactly where that point should be, however, is a question we cannot answer as outside observers. If we could see how much of those net costs are no-trouble-found, how much is goodwill/fraud, and how much is free donuts, then we could make some good guesses.


