


Semiconductor Warranty Report:
Companies that make the tools and equipment used to manufacture semiconductors and printed circuit boards spend more on claims, set aside more accruals, and shell out a larger chunk of their revenue on warranty expenses than do their customers who make the actual devices. But the companies that make the devices keep more warranty reserves on hand than do the companies that supply them with tools and equipment.
In our continuing examination of the warranty spending habits of manufacturers and their suppliers, we usually find that the suppliers pay a smaller share than their customers. But in the semiconductor business, the companies that make the capital equipment and tools that are used to make the actual products pay more than their customers. However, those customers keep more funds in their warranty reserves.
To reach this curious conclusion, we began with the list of 154 semiconductor manufacturers that we used in last week's newsletter, and added to that an additional 17 companies from the aerospace, medical equipment, telecom, and solar power equipment industries that also manufacture semiconductors, but are better-known for the more complete products built around those semiconductors. The largest warranty providers among them are Agilent Technologies Inc.; First Solar Inc.; Honeywell International Inc.; Roper Technologies Inc.; SolarEdge Technologies Inc.; and SunPower Corp.
We then separated that list of 171 companies into two groups: 25 companies that make the equipment, tools and machinery used to manufacture semiconductors and printed circuit boards, and 146 companies that make the actual semiconductors and PCBs. Agilent went onto the machinery list, where it was joined by companies such as Applied Materials Inc.; Coherent Inc.; KLA-Tencor Corp.; and Lam Research Corp. The others went onto the device list, where the other warranty-providing leaders included Advanced Micro Devices Inc.; Cree Inc.; Electro Scientific Industries Inc.; Kulicke and Soffa Industries Inc.; Nvidia Corp.; and Teradyne Inc.
From each company, we gathered four essential metrics: claims paid, accruals made, warranty reserves held, and product sales revenue. We also calculated two additional metrics: the claims rate, by dividing claims paid by sales revenue, and the accrual rate, by dividing accruals made by sales revenue.
Warranty Claims
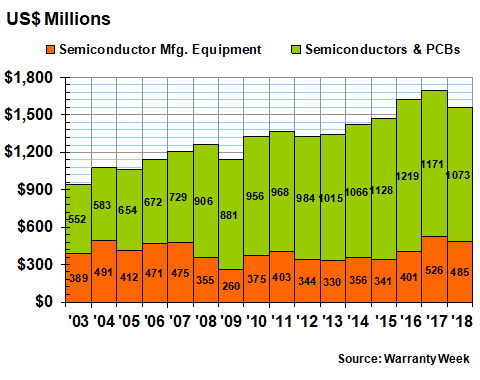
In Figure 1, we are detailing the amount of claims paid per year by each group. In 2018, the device makers saw their claims total fall by $14 million or 3%, to $465 million. The manufacturing equipment makers, however, saw their claims total rise by $171 million, or 39%, to a new record high of $610 million. Together, the two groups paid $1.075 billion in claims, nearly exceeding the records they set from 2006 to 2008.
Figure 1
Semiconductor Industry Warranties
Claims Paid by U.S.-based Companies
(in US$ millions, 2003-2018)
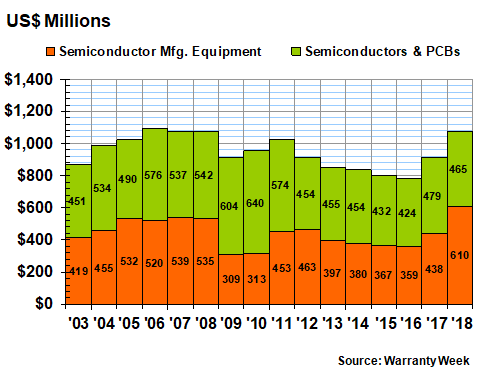
The main contributor to the rise in claims was Lam Research, which saw its annual cost climb from $159 million in 2017 to $271 million in 2018. But Applied Materials saw a $55 million rise in claims payments, and four others saw increases of $10 million or more as well.
In the negative column, Honeywell cut its annual claims cost by $39 million, and KLA-Tencor has reclassified virtually all its product warranty expenses as extended warranty expenses, so its claims cost has dropped from $38 million in calendar 2017 to virtually none in the second half of 2018 (it reported $40.3 million in claims in the fiscal year ended June 30, 2018, just before the reclassification occurred). Others with sizeable claims cost reductions in 2018 included Teradyne, Cree, and Electro Scientific Industries.
But the development worth noting is the relative share of the two groups towards the total in Figure 1. In most of the past 16 years, the split was very close to 50/50. In fact, in 12 of those 16 years, the manufacturing equipment group's share of the total was under 50%. In fact, in 2010 their share slipped under one-third.
Meanwhile, in four of those 16 years, the manufacturing equipment group's share exceeded 50%. It was just a hair over 50% in 2007 and 2012, and in 2005 its share was 52%. But in 2018 its share rose to 57% -- a new record share, as well as a new record total.
Warranty Accruals
Much the same thing happened with warranty accruals. In 2018, the manufacturing equipment group's total rose by 6.3% to $611 million, while the device group's total fell by 5% to $479 million. Together, the two groups saw their accrual total rise by an ever-so-slight one percent, to $1.09 billion.
It was the second year in a row that the manufacturing equipment group's share exceeded 50% of the total. However, 2017 and 2018 are the only two years in which the manufacturing equipment group's share exceeded 50% of the total. Back in 2009, their share nearly dropped to one-quarter of the total. So there has been a massive shift of warranty expense from the actual device makers to the companies making the tools and machinery.
Figure 2
Semiconductor Industry Warranties
Accruals Made by U.S.-based Companies
(in US$ millions, 2003-2018)
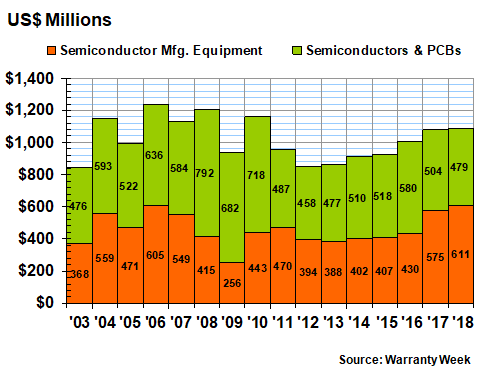
Once again, Lam Research led the increases, boosting its accruals from $219 million in 2017 to $256 million in 2018. But Applied Materials boosted its accrual total by $17 million, and Coherent added $15 million to its total. On the device side, AMD and Kulicke and Soffa each added around $2 million to their annual accrual totals.
On the down side, as was mentioned, KLA-Tencor reclassified most of its accruals as deferred revenue from sales of extended warranties, so that took most of its reported $54 million in 2017 accruals right off the list. In terms of actual accrual reductions, Cree cut its total by $15 million and Teradyne cut its total by $7.5 million.
So we're seeing the same pattern again: big increases reported by the leaders of the manufacturing equipment group, and big decreases reported by the leaders of the device group. And once again, with this warranty metric, there has been a massive shift from the actual device makers to the companies making the tools and machinery.
Warranty Expense Rates
The good news is that sales have also increased for many of the top warranty providers in this industry. Sales were up by 40% for Nvidia, and by 22% for AMD. Agilent, Applied Materials, Cree, and Roper each saw sales increases of 10% of more. This helps to temper any increases in their warranty expense rates, because if sales totals rise faster than either claims or accrual totals, the percentages actually fall.
In Figures 3 and 4, what we've done is to take the totals from Figures 1 and 2 and divide each by the corresponding sales totals. Figure 3 shows the claims and accrual rates for the companies making the tools and machinery. And what it shows is that the group has generally managed to reduce its warranty expense rates, from close to three percent back in 2003 to under two percent in recent years. They ended 2018 with a claims and accrual rate just under 1.5%.
Figure 3
Semiconductor Manufacturing Equipment
Average Warranty Claims & Accrual Rates
(as a % of product sales, 2003-2018)
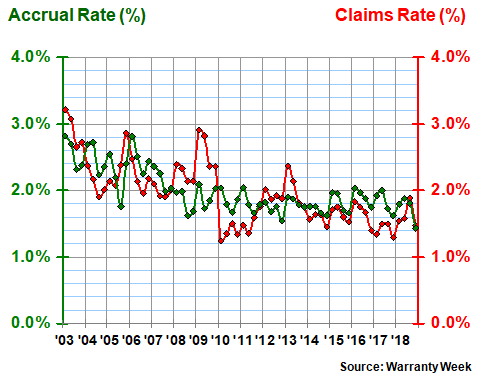
Over the long term, on a quarterly basis, their claims rate has been lower a bunch of times, but especially in 2020, 2011, and 2017. But their accrual rate has never been lower than 1.5%. It ended 2012 just above 1.5%, but that's the closest it's ever come before now.
Therefore, as strange as it seems, two seemingly contradicting trends are at work: first, the manufacturing equipment group's share of the warranty expenses has never been bigger. However, their revenue growth has more than kept up with expenses, so the percentage of sales they're setting aside as warranty accruals, to pay warranty claims in the future, has never been lower.
Much Lower Expense Rates
In Figure 4, we're tracking the claims and accrual rates of the 147 semiconductor device and printed circuit board makers. By using the same vertical scale as was used in Figure 3, we make it clear that this group's expense rates are much lower -- the gap between them has averaged 1.5% over the past 64 quarters.
However, it also makes it more difficult to see the extremes. In general, the device makers' expense rates were highest from 2009 to 2011, and lowest from 2012 to 2015. In recent years, they've been somewhere in the middle, mostly in a range from 0.3% to 0.5%.
Figure 4
Semiconductor Devices & Printed Circuit Board Manufacturers
Average Warranty Claims & Accrual Rates
(as a % of product sales, 2003-2018)
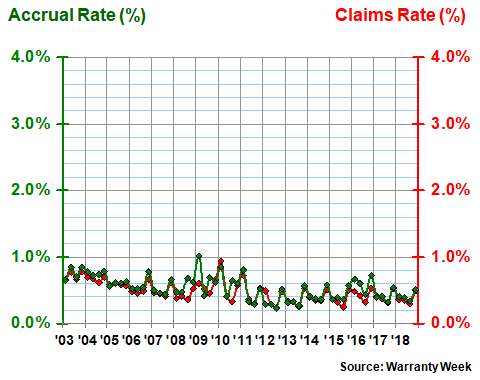
Note that the manufacturing equipment group's expense rates have never been lower than the device-making group's. They came closest in 2010, but never quite crossed paths. And while the gap between them has averaged 1.5%, it dipped under 1.0% in 11 of the 128 possible comparisons (9 for the claims rate comparisons and 2 for the accrual rate comparisons). But the only time both expense rates have been simultaneously within one percent of each other was in the fourth quarter of 2018.
Warranty Reserves
Our last warranty metric is the closing balance in the warranty reserve funds of the 25 manufacturing equipment makers and the 147 device makers. This one is not even close. The device makers have always kept more reserves than the manufacturing equipment makers. In fact, the only time their share of the total ever dipped below 60% was back in 2003 and 2004. In 2009 and from 2013 to 2016, it climbed above three-quarters. Last year and in 2017, it slipped back under 70%.
Figure 5
Semiconductor Industry Warranties
Reserves Held by U.S.-based Companies
(in US$ millions, 2003-2018)
Note, however, that the warranty reserve balance of both groups declined last year -- the manufacturing equipment makers saw a $41 million decline and the device makers saw a $98 million decline. Proportionally, the drop was slightly larger for the device makers, at 8.4%. Measured together, their reserves fell by $138 million to $1.56 billion.
Reserves Compared to Claims
But what's surprising is the relative size of the warranty reserves held by the two groups, compared to what they pay out in claims. If, for instance, a company holds $12 million in reserves and pays $1 million a month in claims, then we could say that they're holding the equivalent of 12 months' or one year's claims in their reserve fund. If they held $24 million in reserves and paid out $1 million a month, then we could say their reserves were the equivalent of 24 months or two years of payments. And so on.
What's surprising is that the manufacturing equipment makers hold comparatively less reserves than their customers. While in 2018 the device makers held the equivalent of 24 months' claims in their reserve funds, the manufacturing equipment makers held only 9 months' worth. And that pattern has held up for most of the past 16 years.
Therefore, even though the manufacturing equipment makers make most of the accruals and pay most of the claims, and have much higher expense rates compared to their customers, those customers keep much more reserves on hand, whether they're measured in dollars or as a multiple of claims. And this is a pattern we haven't seen in either the aerospace, automotive, or computer industries.


