

Homebuilder Warranty Report:
All the metrics were up in 2018, and the growth continued into the first quarter of 2019. Claims and accruals are back to pre-recession levels, and warranty reserves hit a new record high. Meanwhile, the level of warranty expenses per new home sold show some curious and sudden spikes for some builders and long-term stability for others.
While it's rarely a good sign when expenses rise, in the case of single-family homebuilders, the jump last year in warranty expenses was accompanied by sales growth. Claims were up 22% and accruals were up 28%, but sales revenue was up 23%.
To reach this conclusion, we began with a list of 66 publicly-traded and U.S.-based companies that build homes, but removed 11 that were primarily engaged in the manufacture of recreational vehicles and mobile homes. That left us with 55 companies that construct site-built homes, primarily single-family residential structures.
From the financial reports of these 55 companies, we extracted five metrics: warranty claims paid, accruals made, warranty reserves held, home sales revenue, and the number of homes sold. With the claims and revenue figures, we calculated the ratio of claims as a percentage of sales, and with the accrual data, we calculated two figures: accruals as a percentage of sales, and accruals made per new home sold.
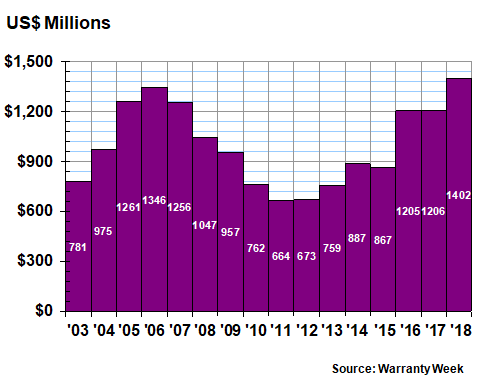
Warranty Claims
In Figure 1 we are tabulating the amount of claims payments reported by these 55 builders during the past 16 years. In calendar 2018, claims soared 22% to $718 million, their highest level since 2007, and their largest annual increase since 2004-2005.
Figure 1
Homebuilding Warranties
Claims Paid by U.S.-based Builders
(in US$ millions, 2003-2018)
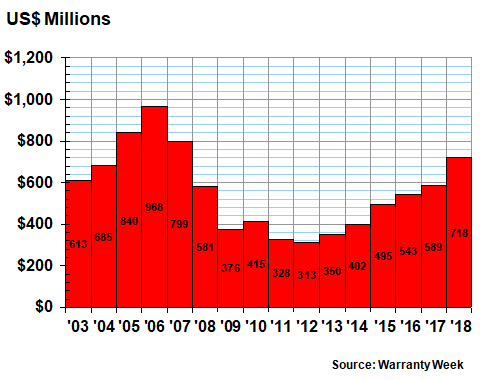
The biggest jump was recorded by Lennar Corp., which in February 2018 acquired CalAtlantic Group Inc., itself a product of the 2015 merger of Standard Pacific Homes and Ryland Homes. Lennar reported claims payments of $165 million in 2018, up by $62 million from 2017 levels. Other large increases included a $31 million jump in claims at Toll Brothers Inc., a $17 million increase at Taylor Morrison Home Corp., and a $15 million increase at Hovnanian Enterprises Inc.
While we're not including RVs and homes on wheels in this week's report, we are including modular homes and manufactured homes, which are built in sections, transported by truck, and then assembled onsite. One of the biggest companies in this sector is Skyline Champion Corp., which was formed a year ago through the merger of Skyline Corp. and Champion Enterprises Holdings LLC. Last year, the company reported paying $26 million in claims, up from Skyline's $8.1 million total in 2017.
In terms of declines, only a handful of builders reported any reductions in claims payments. The largest decline was reported by Beazer Homes USA Inc., which saw its claims total fall by $17 million to $12 million. Others included a $6.5 million reduction by M/I Homes Inc.; a $2.0 million reduction by KB Home; and a $172,000 reduction by Meritage Homes Corp.
Warranty Accruals
In 2018, warranty accruals also soared, to $681 million, up by $148 million from 2017 levels. Once again, it was the highest level for this metric since before the recession, and the largest year-to-year gain since 2004-2005. Normally, such a massive increase in warranty expenses would be nothing to cheer about, but it was driven primarily by a 23% increase in sales revenues.
Figure 2
Homebuilding Warranties
Accruals Made by U.S.-based Builders
(in US$ millions, 2003-2018)
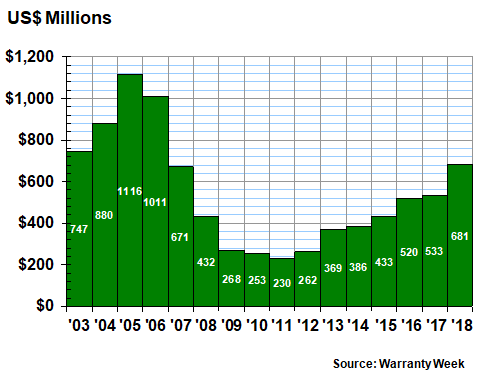
Mergers were again a major factor behind the increase seen with this warranty metric. Skyline Champion nearly tripled its accruals to $27 million, and Lennar added $66 million to its $109 million total in 2017. But there were other big increases as well. Taylor Morrison added $24 million; NVR Inc. added $18 million, and both M.D.C. Holdings Inc. and PulteGroup Inc. boosted their accruals by about a third. William Lyon Homes and Cavco Industries Inc. boosted their accrual totals by about one-fourth.
Once again, there were relatively few accrual reductions. The largest was Beazer Homes, which cut its accruals by about one-fourth. Meritage cut its accruals by $1.3 million; KB Home cut its accruals by $660,000; and Hovnanian reduced its accruals by about $500,000. The latter was responding in part to a 19% drop in sales, but all the others saw sales increases.
Warranty Accrual Rates
The reason we mention sales in conjunction with accruals is the fact that they traditionally rise or fall together. If a company sets aside $2,500 in accruals per home sold, that ratio would more or less remain the same whether the company sells more or less homes than the year before, unless there's been a change in expectations for warranty costs in the future.
Fortunately, homebuilders have been generally forthcoming with statistics about both the accruals they make and the number of units they sell, so comparisons of the two metrics have been a reliable indicator. And while some companies sell primarily starter homes while others sell luxury models, they don't switch production from one to the other from one year to the next.
We should note that we're tracking homes actually sold to a customer, not homes ordered or homes built. And each company uses a slightly different label for their unit sales figures. MDC Holdings uses the simple label "homes." Beazer and Pulte call them "closings." NVR refers to them as "settlements," and Lennar calls them "deliveries." Toll Brothers uses two terms interchangeably: "deliveries" and "units delivered." Hovnanian and KB Home call them "homes delivered." D.R. Horton Inc., Taylor Morrison, and Meritage calls them "homes closed." And William Lyon Homes counts the "number of homes closed."
Whatever they're called, they represent an additional way to measure the ratio between a product and the warranty expenses expected in the future for that product. We have the ratio between sales and accruals, measured as a percentage, and we have the ratio between units and accruals, measured in dollars.
In Figure 3, we're tracking both ratios at the same time. In addition, because it's June and most of these companies released their financials for the first quarter of 2019 last month, we're including data for the past 65 quarters, from the first quarter of 2003 to the first quarter of this year. The scale for the accrual rate as a percentage is in green on the right, while the accrual rate per home sold is in blue on the left.
Figure 3
Homebuilding Warranties
Average Warranty Accrual Rates
($ per home and % of revenue, 2003-2019)
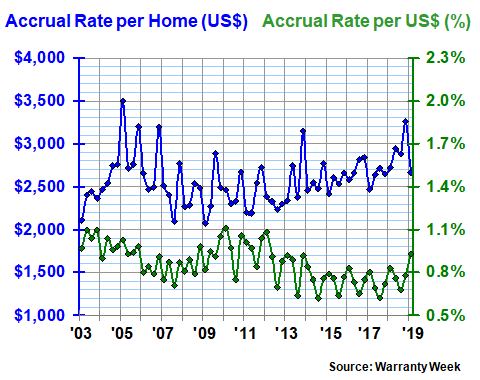
At the end of 2018, the average accrual per home sold was $3,258, and the accrual rate was just under 0.8% of home sales revenue. In the first quarter of 2019, however, the rate per home dropped to $2,668 while the percentage of revenue rose to 0.9%. Long-term, the average accrual rate per home sold is $2,577, with a standard deviation of $286. The average accrual rate as a percentage of sales was 0.9%, with a standard deviation of 0.1%.
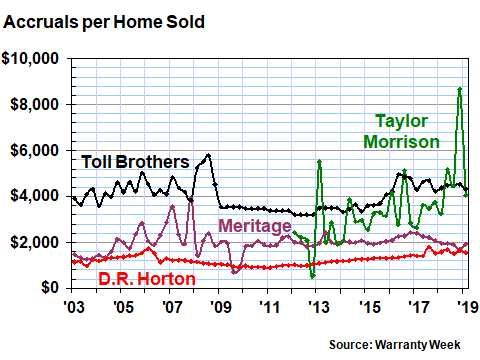
Accruals Per Home Sold
In the next five charts, we will track the accrual rate per home sold for 17 of the largest homebuilders, in groups of three or four companies per chart. We'd love to be able to do it in one huge chart, but it would be virtually unreadable. Part of the reason for that is the sheer variability of the data. In some quarters, certain builders will make no accruals at all, while in others they will set aside more than $15,000 per home sold. But despite this volatility, the long-term average is close to $2,500.
In Figure 4, we can see that during the months of October, November, and December 2018, Taylor Morrison set aside nearly $8,700 per home sold. The company said it was a "repair issue" in its central region, which caused it to recognize "an incremental $39.3 million warranty charge." However, it also boosted its "additions to reserves" by $24.1 million, to $51.7 million for the entire year and $26.9 million for just the fourth quarter. And since it closed the sales of 3,106 homes during the fourth quarter, this resulted in a cost of $8,664 per home sold.
But as the first-quarter-2019 data shows, this was a one-time spike in accruals. During that period, Taylor Morrison sold 1,938 homes and accrued $7.9 million, for an accrual rate per home of $4,050. That's still on the high side for that builder, but is within its historical range.
Figure 4
Homebuilding Warranties
Warranty Accruals Made per Unit Sold
(in US Dollars, 2003-2019)
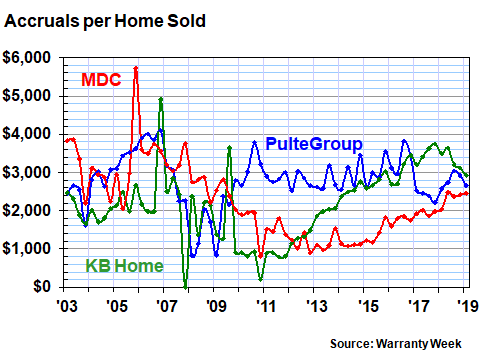
In Figure 5, we can see that MDC suffered its own accruals spike in late 2005. KB Home suffered one in late 2006. But in late 2007, apparently every home it built was perfect, because it made no accruals. Both companies saw their accrual rates drop during the recession but they have been rising steadily in recent years. However, KB Home was once again below the $3,000-per-home level in early 2019.
Figure 5
Homebuilding Warranties
Warranty Accruals Made per Unit Sold
(in US Dollars, 2003-2019)
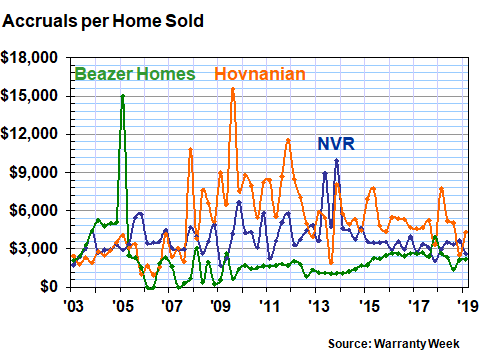
In Figure 6, we can see that both Beazer Homes and Hovnanian suffered major spikes to their accrual rates, in early 2005 and mid-2009, respectively. In fact, the sheer size of those spikes helps to mask the spikes that NVR suffered in 2013, when accruals per home suddenly rose in both the second and fourth quarters. All three companies are now back down into the normal range in recent quarters, however.
Figure 6
Homebuilding Warranties
Warranty Accruals Made per Unit Sold
(in US Dollars, 2003-2019)
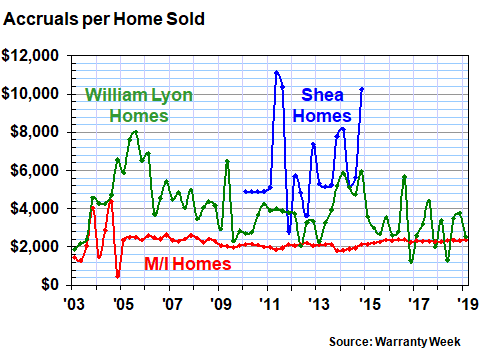
In Figure 7, we're including a privately-held builder named Shea Homes, which from 2010 to 2014 issued publicly-traded bonds, and which therefore had to release its financials to the public. But also note that while most of the previous charts have been somewhat erratic, the data of M/I Homes has been amazingly close to $2,200 per home sold. Of the 17 companies in these charts, it also has the second-lowest standard deviation, which is a mathematical measure of stability.
Figure 7
Homebuilding Warranties
Warranty Accruals Made per Unit Sold
(in US Dollars, 2003-2019)
The lowest standard deviation belongs to D.R. Horton, which has kept its accrual rate per home close to $1,200 over the long term, though it has been rising slowly over time as home sale prices also rise. This is a sign of stability, in that the company is setting aside a near-constant amount of funds each time a new home is sold. Another contender for the stability prize is Meritage Homes, which has kept its accrual rate per home close to $2,000. NVR, Hovnanian, Beazer, Taylor Morrison, and William Lyon, however, have the least stable track records over the past 65 quarters.
In Figure 8, we're really tracking only one surviving company: Lennar. But we can see how the company's acquisitions have fared over the past 16 years. As was mentioned, Ryland and Standard Pacific merged in 2015 to form CalAtlantic, and then Lennar acquired CalAtlantic last year. Unfortunately for Lennar, the ultimate outcome has been an increase in accruals to their highest rate since 2006. It's not catastrophic -- it's still less than one percent of revenue. But the upward trend is unmistakable.
Figure 8
Homebuilding Warranties
Warranty Accruals Made per Unit Sold
(in US Dollars, 2003-2019)
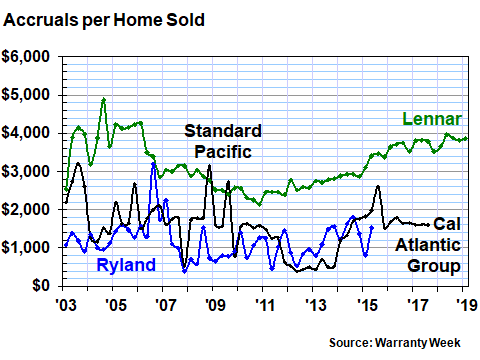
What the accrual rate per home metric misses is the gradually increasing sales price per home. That's taken into account by the accrual rate when expressed as a percentage of revenue, however. And with that metric, Lennar's accrual rate is actually down slightly from the end of 2017.
Another surprising merger outcome was reported by Skyline Champion. The company's accruals tripled, but its sales doubled. And in the end, because both metrics jumped together, its accrual rate remained almost unchanged at 2.6%. That would be high for a site-built home, but it's in the normal range for modular homes. Cavco Industries Inc., a competitor, actually saw its accrual rate jump from 2.7% in 2017 to 4.6% in 2018.
In terms of non-merger-related accrual rate changes for site-built home companies, the biggest year-on-year increases were reported by Taylor Morrison, NRV, and Hovnanian. The biggest declines were reported by Beazer and Meritage.
The highest non-modular accrual percentage rate belonged to Hovnanian, while the lowest was reported by Meritage Homes. Hovnanian also had the highest average accrual rate per home, at $5,200. Meritage was the second-lowest, at $2,000 (D.R. Horton was lowest). But again, one would expect higher accrual rates per home for luxury models with higher selling prices, and lower rates per home for starter homes.
If we were to divide the top builders into three groups, for low, medium and high accrual rates per home sold, we would do so as follows: in the low group would be Beazer Homes, D.R. Horton, KB Home, and Meritage. The five in the middle would be Lennar, MDC, M/I Homes, PulteGroup, and Taylor Morrison. And then the four at the top would be Hovnanian, NVR, Toll Brothers, and William Lyon Homes.
Warranty Reserves
Our final warranty metric is the balance at the end of the year in the warranty reserve funds of all the homebuilders. In 2018, they set a new record with just over $1.4 billion in their reserves, surpassing the previous record set in 2006. The annual increase, however, was much smaller than the big jumps seen in 2015-2016 and 2004-2005. And on a percentage basis, it was also smaller than the 2003-2004 increase.
Figure 9
Homebuilding Warranties
Reserves Held by U.S.-based Builders
(in US$ millions, 2003-2018)
Once again, the mega-mergers led the increases. Lennar doubled its reserve balance and Skyline Champion more than tripled its year-ending balance. Other big increases included Taylor Morrison, up 84%, D.R. Horton, up 38%, and MDC Holdings, up 29%. KB Home, NVR, Cavco, Pulte, and Meritage saw their reserve totals rise modestly.
There were only a handful of declines. Hovnanian cut its reserves by 26%, while Toll Brothers cut its accruals by 21%, and Beazer Homes cut its reserves by 15%. M/I Homes and William Lyon Homes kept their reserve balances relatively steady.
National Statistics
There is one more metric worth noting. According to the U.S. Census Bureau, there were 657,000 new homes sold in the U.S. last year. These define the warranty-issuing portion of the housing market. Typically, the warranty duration is one year for the walls, two years for the heating and cooling systems, and 10 years for major structural defects. While some quick sales of young existing homes might still have some amount of transferrable warranty coverage left on them, most existing homes are sold as-is (although home warranties or service contracts can be purchased by either the seller or the buyer).
According to our totals, 205,000 or just under a third of the total are represented by the warranty-reporting public companies tracked in this week's report. In other words, we have warranty metrics for 31% of the units. For those companies, unit sales were up 10% last year. And for anyone worried about an industry slowdown, unit sales by these companies were also up by 10% in the first quarter of 2019, compared to the first quarter of 2018.


