Product Warranty Sectors:
By dividing all warranty-issuing companies into three groups -- vehicles, buildings, and electronics -- we can look at trends over time in terms of claims, accruals, reserves, and the percentage of sales revenue spent on warranty expenses. And we can also see that those expense rates have recently taken an upturn for some of them after years of declines.
By far, the largest part of the warranty world is in the vehicle industry. And while the second-largest slice of the pie is in high-tech electronics, its share is slowly declining. Meanwhile, the warranty expenses of companies engaged in the building trades continues to grow, and their share of the warranty reserve fund total has already surpassed those of the electronics manufacturers.
To reach these conclusions, we began by gathering several warranty metrics from the quarterly financial statements and annual reports of all U.S.-based manufacturers from 2003 to 2019. For each company, we logged the amount of claims paid, accruals made, and reserves held during each period. We also logged the reported amount of product sales, and used that figure to calculate the claims rate (claims/sales) and the accrual rate (accruals/sales).
We split up the universe of warranty-issuing manufacturers into three huge sectors: those that make vehicles (cars, trucks, buses, planes, ships, bikes, etc.), electronics manufacturers (computers, medical equipment, telecom gear, consumer electronics, etc.), and those engaged in the building trades (appliances, HVAC, new homes, electrical & plumbing fixtures, furniture, security systems, building materials, etc.). Obviously, there is some overlap between the sectors -- for instance, semiconductor manufacturers whose products are used in cars or avionics, or those who make security cameras and Internet doorbells for new homes -- but we did our best to sort each company into the most appropriate sector.
Usually we present this data in annual increments, but since 2019 ended only three weeks ago, we won't have any fourth-quarter data until the annual reports start coming out in March. So what we're tracking in the charts that follow are the warranty metrics over the past 67 quarters -- one report shy of 17 full years.
In Figure 1 we're looking at the amount of claims paid per quarter by U.S.-based companies in the three sectors. Usually, the vehicle manufacturers account for about 48% of the total, but in mid-2019 their share rose as high as 54% of the total. The electronics manufacturers usually account for about 36% of the total, but in mid-2019 their share fell below 30%. And finally, those in the building trades usually account for about 16%, but their share rose as high as 19% in late 2018.
Figure 1
Manufacturer Warranties
Claims Paid by U.S.-based Companies
(in US$ millions per Quarter, 2003-2019)
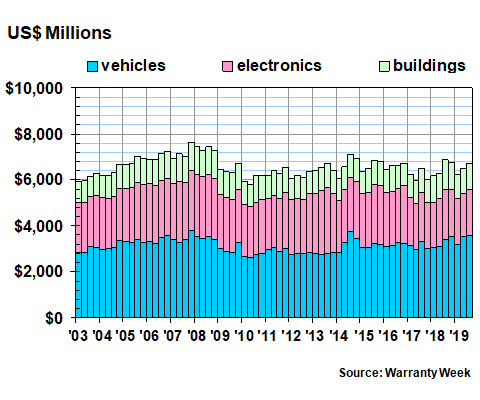
So far, during the first nine months of 2019, we have counted $19.45 billion in claims paid, and that's up by $130 million from the same nine months of 2018. However, we should keep in mind that some companies, such as General Electric, Honeywell, and Eaton, report their warranty expenses only at the end of each year, so we won't have any new data from them for another month or two. In the meantime, we are including place-saving estimates for each of them based on their 2018 metrics.
Although the all-manufacturer total was up by $130 million, all of that increase came out of the vehicles sector. The electronics sector was down by $305 million to $5.9 billion during the first nine months of 2019, while the building trades paid $278 million less in claims, an eight percent drop from 2018 levels.
Warranty Accruals
In Figure 2, we're looking at the amount of warranty accruals set aside by U.S. manufacturers over the past 67 quarters. Note that the quarterly amounts are more erratic than they were for claims (Figure 1). Note also that the source of much of that instability is the electronics sector.
As we will see in the weeks ahead, as we drill down into the sectors, one of the primary causes of this phenomenon are companies that somewhat capriciously stuff large amounts of accruals into the final quarter of each calendar year. In fact, you'll notice that from 2011 to 2017, the high quarter for electronics accruals was always the fourth quarter. That trend was finally broken in 2018.
Figure 2
Manufacturer Warranties
Accruals Made Paid by U.S.-based Companies
(in US$ millions per Quarter, 2003-2019)

During the first nine months of 2019, U.S.-based manufacturers have set aside $18.23 billion in warranty accruals, up only $68 million from 2018 levels. But once again, the vehicles sector was the only one to show an increase ($165 million). The electronics sector was down $76 million to $5.48 billion, while the building trades were down $21 million to $3.49 billion.
Warranty Expense Rates
We are tracking 232 companies in the vehicles sector; 675 companies in the electronics sector; and 350 companies in the building trades. At some point in the past or present (mostly in the past), they have reported warranty expenses (there have been numerous mergers and acquisitions since 2003).
In this next section, what we have done is to add up all of their reported claims and accruals, and divide each by the amount of product sales. That's not the same as total sales. Some companies make a significant amount of money from services, licensing, mortgages, investments, royalties, and other non-product sources. That's wonderful, but there are no warranties involved in those sources of revenue. So they have been subtracted in order to make the claims and accrual rates more relevant to actual expenses.
In Figure 3, we're looking at the track record of the vehicle manufacturers. Over the past 67 quarters, their claims rate has averaged a little over 1.5%, while their accrual rate has averaged a little under 1.5%. So it's no surprise to find that most of the time, with the exception of the recall-heavy year of 2014, the claims rate has been higher than the accrual rate. In the recessionary year of 2009, in fact, the claims rate spiked to its highest-ever level, not because there were more claims, but because there were less sales.
Figure 3
Vehicle Manufacturers
Average Warranty Claims & Accrual Rates
(as a % of product sales, 2003-2018)
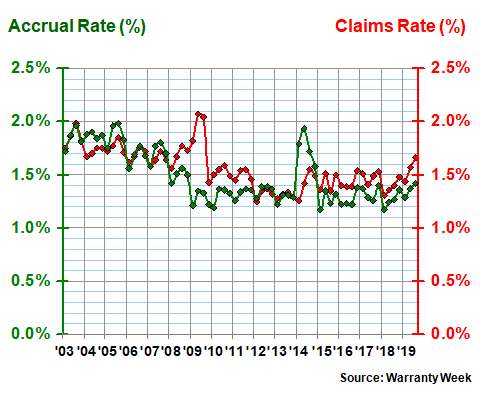
The biggest news in Figure 3 is the downward trend in warranty expenses seems to be ending. From 2003 to 2011, expense rates were primarily between 1.5% and 2.0%, though they sometimes fell outside that band. From 2012 to 2017, the rates were mostly at or under 1.5%, with the exception of 2014. But in 2018 and so far in 2019, both the claims and accrual rates have slowly risen.
Electronics Warranty Costs
The surprise in Figure 4 is that the warranty expense rates in the electronics sector have generally been a bit higher than they've been in the vehicle sector. And while their expense rates also generally declined from 2.0% to 1.5% (from 2003 to 2012), since then they have just been plain erratic. One quarter they're under 1.2%, and the next quarter they're half a percent higher.
Figure 4
Electronics Manufacturers
Average Warranty Claims & Accrual Rates
(as a % of product sales, 2003-2018)
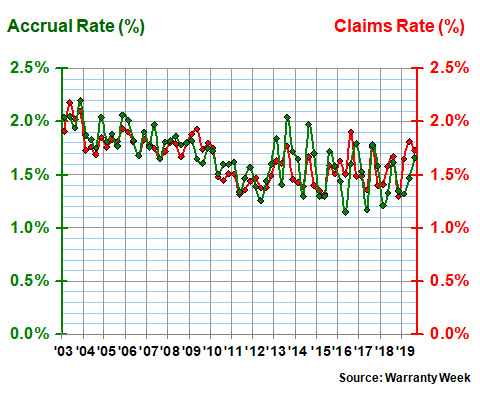
Long term, the electronics sector has seen an average claims rate of 1.65%, and an average accrual rate of 1.67%. And a glance at Figure 4 confirms that the two rates have generally been close to one another. In the vehicle sector, manufacturers tend to cover the accrual shortfall with occasional changes in estimate. Those are less necessary in this sector. However, the erratic shape seen here echoes the pattern seen in Figure 2, where the accruals of the electronics sector seem to have a mind of their own from one quarter to the next.
Warranty Costs in the Building Trades
The big surprise in Figure 5 is that warranty costs in the building trades, at least as a percentage of revenue, tend to be lower than they are for either vehicles or electronics. They're also less erratic than either of the other sectors, although there is a tiny hint of the recessionary spike in the 2009 data below.
Figure 5
Building Trade Manufacturers
Average Warranty Claims & Accrual Rates
(as a % of product sales, 2003-2018)
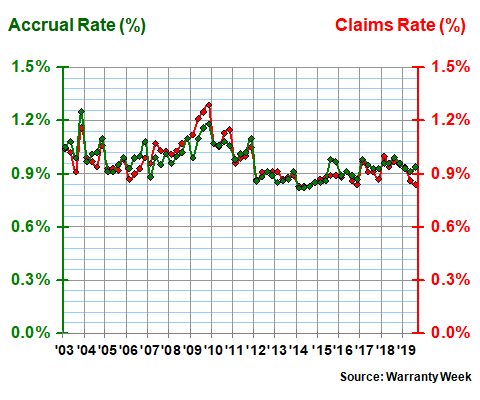
Over the long term, the claims and accrual rates in this sector have averaged just under one percent, though that smooths over the vast difference between high-expense-rate industries such as major appliances and heating/cooling systems, and low-expense-rate industries such as fixtures and furniture.
Also, the math tells you what your eyes can already see. Volatility, as measured by the standard deviation of the expense rates over time, is lowest in the buildings sector, and highest in the electronics sector. So the companies in this sector have both the lowest and the most consistent claims and accrual rates.
Warranty Reserve Fund Balances
Finally, we have one more metric to detail. In Figure 6, we are looking at the ending balance of the warranty reserve funds of all the companies that report those balances. Keep in mind that for all the once-a-year warranty metric reporters, we're pretending that their balances have remained unchanged since the end of 2018. Those estimates will be replaced by real data as their annual reports are published.
Figure 6
Manufacturer Warranties
Reserves Held by U.S.-based Companies
(in US$ millions per Quarter, 2003-2019)

As of September 2019, the balance in all the warranty reserve funds stood at $42.14 billion, up about $460 million from September 2018. But once again, not all sectors showed an increase. The balance in the vehicle sector was up by $850 million to $25.5 billion. It was down by $470 million to $7.57 billion in the electronics sector. This time, however, the tie-breaking building sector was up a little under one percent in the past year to just over $9 billion, though it was actually slightly higher than $9.1 billion at the end of the four intervening quarters.
Also, note that the highest reported balances for all manufacturers, for just the electronics manufacturers, and for the vehicle manufacturers all came in 2014. It's only the building trades balance that hit a new high in 2019.
And finally, although this is a subjective measurement, note that the data in Figure 6 is the most consistent from one quarter to the next. There's a rising trend from 2003 to 2007, then a dip and regrowth from 2008 to 2014, and then a general decline from 2015 to 2019. But there are no sudden spikes or troughs, as there were in the other charts, except perhaps a few outliers in 2016 and 2017.
Over time, the vehicle sector has accounted for about 58% of the total, though their share rose above 60% in 2019. The electronics sector has accounted for about 24%, though their share is down below 20% in recent years. And the balance in the building trades has generally accounted for about 18% of the total, though it has been higher than the electronics sector's share for the past nine quarters.