Warranty Expense Inflation:
Prices rise and so does the cost of warranty. Over the past 17 years, prices in dollars have risen almost 40%. If we were to adjust warranty expenses for inflation, it makes the most recent claims and reserve data look a bit worse.
A longtime reader noted that all the figures in last week's newsletter were presented in nominal dollar amounts, unadjusted for inflation. And since U.S. prices have risen by almost 40% since the start of 2003, this could add a significant amount of error to the historical totals in the charts. So does it?
It's possible, we said. Let's take a look at the data. As was detailed in the January 23 newsletter, for each U.S.-based manufacturer that reports their warranty expenses, we gathered data from their financial statements on the amount of claims paid, accruals made, reserves held, and sales made. For this week's exercise, we also collected monthly price inflation data for the years 2003 to 2019 from the U.S. Bureau of Labor Statistics.
We combined the two, effectively deflating the 2003 warranty and sales metrics by nearly 40% and each quarterly measurement since then by a slightly lesser amount, until the third quarter of 2019 was left as-is. In effect, what we did was recast the old data as if they were reported in today's dollars, with today's purchasing power, saying in effect that $1.0 million dollars spent on parts and labor in 2003 would be equivalent to $1.394 million dollars spent today, after adjusting for inflation.
From one year to the next, at least in recent years, inflation has not changed prices by much. The official inflation rate in 2018-19 was 2.3%, which is a bit higher than the last decade's average, but is right in the middle of the extremes: 0.7% in 2014-15 and 3.0% in 2010-11. But while it has only a small year-to-year effect, over 17 years the accumulated increases add up to nearly a 40% change.
Importantly, this exercise has no effect on the claims rate or the accrual rate, because both of those warranty metrics and the sales data are equally affected by the inflation calculations. In other words, if the old claims rate was 2.0% = $20,000 / $1 million, the new calculation is still 2.0% = $27,880 / $1.394 million. It's still the same percentage of sales going towards warranty expenses, even after adjusting for inflation.
Manufacturing Sales Data
Let's start with the usually unseen sales data this time. In past newsletters, we've briefly noted that U.S.-based companies have usually reported about $2 trillion in warranted product sales in each of the years from 2012 to 2018. But we've never seen a need to chop that up any further by industry sector or by quarter. In Figure 1 we're doing that.
Figure 1
Warranty Expense Inflation
Constant-Dollar Warranted Product Sales Totals,
First Quarter 2003 to Third Quarter 2019
(sales in millions of US dollars)
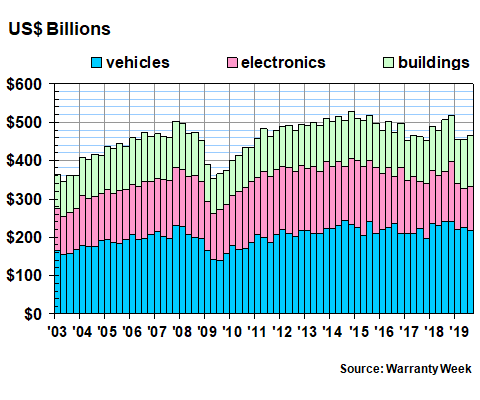
In calendar 2018, warranted product sales by U.S.-based companies totaled just over $1.99 trillion, up about 8.6% from 2017 levels, in nominal dollars. So far in the first nine months of 2019, however, warranted product sales are down by 6.6% to $1.375 trillion, in nominal dollars.
Sales are down by 14.5% in the electronics sector, which includes computers, medical equipment, telecom gear, and consumer electronics; are down by 6.4% in the vehicles sector, which includes cars, trucks, planes, and parts; and are up by 1.6% in the buildings sector, which includes appliances, HVAC, new homes, fixtures, and building materials.
In recent years, the vehicle sector has accounted for 43% to 49% of the sales, while the building sector has accounted for 23% to 28%. The electronics sector has accounted for a shrinking share, and is actually now a bit smaller than the building sector. That's no surprise given the decline in sales.
All of that can change when the fourth quarter 2019 data arrives, as it is beginning to do this week. When it's all available towards the middle of March, we will add it into the database and see how the full year went. But as the data in Figure 1 suggests, there will probably be some annual declines in manufactured product sales revenue.
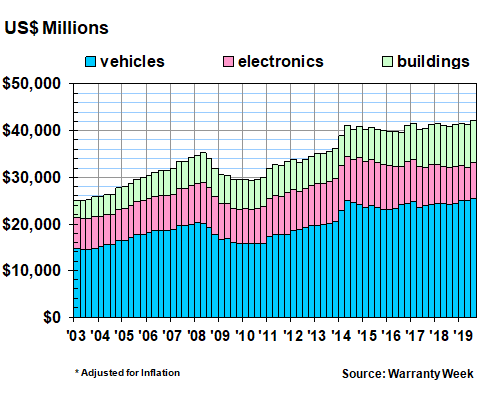
Inflation-Adjusted Sales
The data in Figure 1 is as reported, with no adjustments. In Figure 2, we're applying the BLS inflation data, effectively reducing the 2003 totals by nearly 40% to reflect the change in prices since that time. And when we do so, what immediately stands out is what a peak year 2018 turned out to be. In no other quarter did warranted product sales meet or exceed $500 billion. And in each quarter of 2018, the totals are higher than they were in the corresponding quarters of either 2017 or 2019.
Figure 2
Warranty Expense Inflation
Inflation-Adjusted Warranted Product Sales Totals,
First Quarter 2003 to Third Quarter 2019
(sales in millions of US dollars)
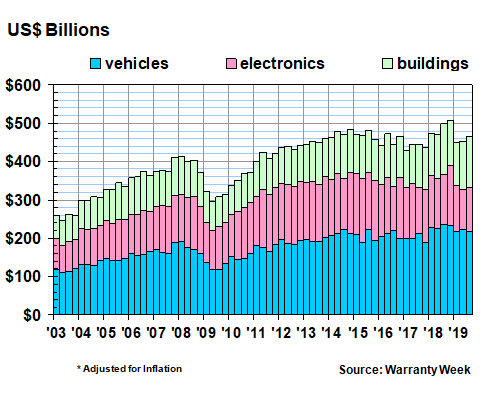
We should note that all of the U.S.-based manufacturers we track report their warranty expenses as one set of numbers for all their products and divisions worldwide. So the data in Figures 1 and 2 is also worldwide for these U.S.-based companies. And while it does include Apple iPhones made in China and Teslas sold in Europe, it does not include the sales of either importers or internationally-based companies such as BMW and Toyota that own factories or subsidiaries in the U.S. Those we'll do separately later on in the spring and summer, as the annual data comes in.
Also, whenever possible, we try to avoid collecting data for revenue derived from services, investments, royalties, mortgages, land sales, and other non-warranted sources. But we're at the mercy of the finance people who decide when and how to segment their companies' revenue. So it's not always possible for external observers to make those subtractions. And of course there are numerous manufacturers who make products but do not issue formal product warranties for them, such as those that make food, clothing, books, software, chemicals, oil & gas, cement, gravel, and most military equipment, for instance.
Inflation-Adjusted Claims Totals
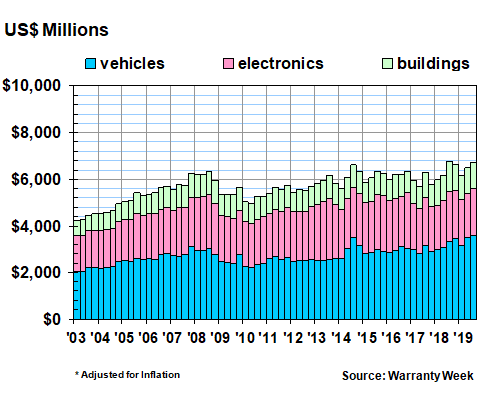
In the next three figures, we're taking the data presented in the January 23 newsletter and adjusting it for inflation. Figure 3 does that for quarterly claims. Figure 4 does it for quarterly accruals. And Figure 5 does it for end-of-quarter reserve fund balances.
When we adjust for inflation, claims payments clearly peaked in 2018, rather than in 2014, as was the case with the nominal-dollar data presented last week. That's because there's been around 8% inflation since 2014, so those as-reported totals from that year had to be reduced by 8%.
Figure 3
Warranty Expense Inflation
Inflation-Adjusted Claims Paid by U.S.-based Companies
(in US$ millions per Quarter, 2003-2019)
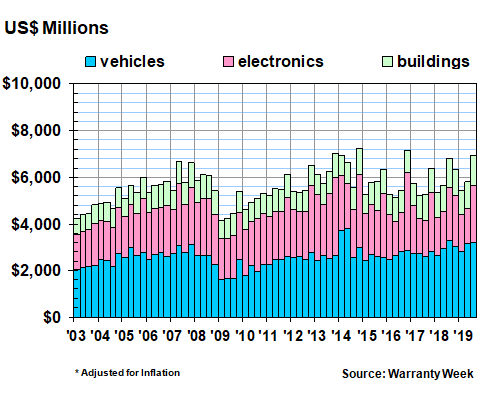
The inflation-adjusted accrual data in Figure 4 remains just as chaotic as before, but the all-time peaks now come in 2014 and 2016 rather than way back in 2007. That's because prices have risen by about 23% since then, so the nominal totals gathered that year have been reduced by 23%. In other words, the $7.9 billion that U.S.-based manufacturers set aside as warranty accruals during the final quarter of 2014 would be worth only $7.2 billion today. But even after that downward revision, it's still the most they ever set aside.
Figure 4
Warranty Expense Inflation
Inflation-Adjusted Accruals Made Paid by U.S.-based Companies
(in US$ millions per Quarter, 2003-2019)
The warranty reserve fund data, after adjusting for inflation, is the metric that gets the most help from the inflation adjustments. While the unadjusted data included in last week's newsletter showed a balance that has been slowly declining since 2014, inflation adjustments make it look flat-to-increasing slowly. In fact, with these adjustments, the only clearly downward trend for warranty reserves was from 2008 to 2010.
Figure 5
Warranty Expense Inflation
Inflation-Adjusted Reserves Held by U.S.-based Companies
(in US$ millions per Quarter, 2003-2019)
Also, after adjusting for inflation, the highest-ever balance for all manufacturers is the $42.14 billion recorded during the quarter ended September 2019. The highest-ever balance for just the vehicle manufacturers was recorded during the same quarter, and the highest-ever for the building material sector is the previous quarter. Only the reserve balance of the electronics manufacturers peaked in a different year (2014).
And by depressing the 2018 totals by a few percentage points to account for inflation (officially 2.3% in 2019), it makes some of the 2018-to-2019 expense increases look concerning, rather than slight. For instance, the amount of claims paid by the vehicle manufacturers during the first nine months of 2019 would be up by 9.3% if adjusted for inflation. The amount of accruals by electronics manufacturers would change from a slight decline to a slight rise.
Therefore, these inflation adjustments would theoretically help those who want to portray the most recent warranty expense totals as the "highest ever," and something to worry about. That would be the inflation-adjusted trend for both claims and reserves: concerning.
Meanwhile, the inflation adjustments to sales totals put a spotlight on 2018 as a peak year for manufacturing, and 2019 as a year of slight declines from that peak. That's not good news to hear at a time like this, which is filled with uncertainty on several levels. But no matter how much inflation adjusting we do with the accrual data, it still looks arbitrary and chaotic, especially in the fourth quarters of each year. So that's not good news either: accruals may not be a very reliable warranty metric, compared to claims and reserves.
Bottom line, most of the comparisons we do are between data sets from consecutive years, or portions of years. And over such a short term, these inflation adjustments don't really change the numbers by much. As long as inflation remains in that low-end 1%-to-3% band, it's probably less confusing if we stick to presenting the nominal data, as reported by the companies themselves, especially for the short-term comparisons.
Also, as the fourth quarter numbers begin to arrive in the weeks ahead, we should note that some companies such as General Electric and Honeywell publish their warranty expenses only once a year, at the end of each year. Therefore, that is going to change some of this data. In the totals and averages above, we had to hold the sales and warranty expense data for those yet-to-report companies constant from 2018 levels. That's going to change when the annual data arrives, but it will be at least another month before we know if it was up or down for them.