Warranty Claims & Reserves, Part 3:
While some of the sub-groups within the buildings category are dominated by companies such as Whirlpool, Carrier, and GE, others contain dozens of similarly-sized manufacturers. And while some of their warranty metrics are all over the chart, others are clumped into relatively tight clusters, like a marksman who never misses his target.
In our warranty industry categories, if it's not part of a vehicle or a piece of electronics equipment, it must belong in the building trades. And while the entire sector's warranty metrics seem fairly predictable, some of the sub-categories within it exhibit much more widely-ranging metrics.
We began with a list of 350 companies that are, or have been, in the building trades in some way over the past 17 years. They include new home builders, makers of the fixtures, furniture, floors, windows, and carpets that fill them, as well as all the appliances and heating/cooling systems that power them. We also included all the manufacturers of electrical power equipment and material handling systems because, frankly, they fit better here than they would in either vehicles (Part 1, Feb. 6) or electronics (Part 2, Feb. 13).
From each of their annual reports and quarterly financial statements, we gathered three essential metrics: the amount spent on warranty claims, the balance in their warranty reserve funds, and the amount of warranted product sales they reported. The latter metric is highly dependent on the level of detail the companies provide in their revenue segmentation. For some that avoid doing much of that, we had to use total revenue. But wherever possible, we subtracted out all service revenue, royalties, mortgages, interest, land sales, consumables, and other non-warranted revenue sources.
The Two Ratios
With the claims and sales data, we calculated the claims rate, defined as the percentage of revenue going towards the payments and costs of warranty work at any particular point in time. For most companies, we have collected 67 such data points over the past 17 years, through the end of the third quarter of 2019. The fourth quarter data continues to arrive daily, and we will switch to an analysis of that in March.
We also calculated the amount of claims being paid each month, so that we could divide the reserve balance by that amount to figure out how many months that reserve fund has in terms of capacity. In other words, if a company has $200 million in sales, $18 million in reserves, and pays $3 million in claims per three-month quarter, its claims rate is $3m / $200m = 1.5%, and its warranty reserve capacity is $18m / ($3m / 3 mo.) = 18 months.
In fact, for all U.S.-based manufacturers, over the past 17 years, the industry average for vehicles, electronics and building trades has been exactly 1.5% and 18 months for the claims rate and reserve capacity, respectively. In the building trades specifically, the averages have been a little different: 1.0% and nearly 21 months, respectively.
The way to read the data in the following six charts is to look for a tight cluster, as if a marksman was hitting their target repeatedly. On the one hand, the lack of a left-right spread means claims are under control, and on the other hand the lack of a top-to-bottom spread means that reserves are sufficient and consistent.
If claims rise and accruals don't also do so in response, the reserve fund balance will drop and the data points will head in the southeast direction. And if claims fall and accruals don't, the data points will head in the northwest direction. If there are excess reserves, there will be more data points on the top side, above the cluster. If reserves are low, there will be more data points below the cluster. Either way, a scatter-shot pattern means the warranty metrics are a bit out of control.
All The Building Trades
What we've done in Figure 1 is to place all 67 available data points for all the building trades onto a single chart. The all-industry weighted average is at the center: 1.5% and 18 months. By the placement of the data points, it's clear that the building trades are always below average in terms of the claims rate, since all the dots are to the left of center, clustered around the 1.0% level (with an 0.1% standard deviation). But in terms of reserve capacity, they've been both above and below the all-industry average, as befits a data set that averages 20.6 months with a standard deviation of 2.7 months.
Figure 1
Building Trade Warranties
Claims Rate & Reserves Held by U.S.-based Companies
(as % of sales & months of coverage, 2003-2019)
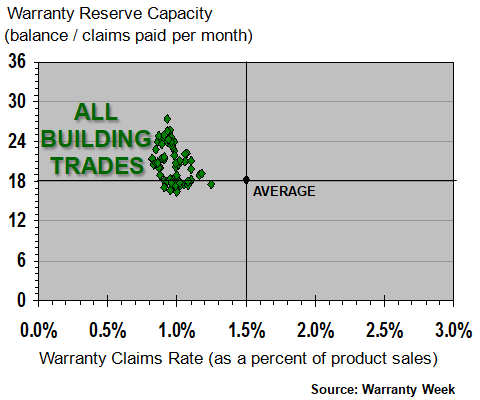
Notice how closely clustered all the data points are. This is a sign that the manufacturers are keeping their warranty expenses both consistent and predictable. However, as we delve deeper into the data, we will see that not all of the industry segments within the building trades are so well-behaved.
New Home Builders
The new home builders, for instance, are close to the sector averages, with a 1.0% average claims rate and 22 months of warranty reserve capacity. However, the data points are in a much less tight cluster, as reflected in their much larger standard deviations (0.3% and 4.7 months, respectively). In some quarters, their warranty reserve capacity has exceeded 2-1/2 years. At other points, it has dipped to just above the one-year level.
Figure 2
New Home Builders
Claims Rate & Reserves Held by U.S.-based Companies
(as % of sales & months of coverage, 2003-2019)
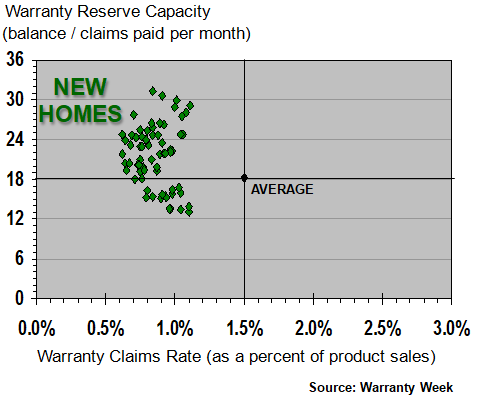
Given that the duration of the warranties covering the different components of a new home typically fall into the one-, two-, or 10-year category, this level of warranty reserve capacity seems appropriate. What this means for any given builder is that should they ever go out of business, and cease selling new homes, the amount of funds left in their warranty reserve funds should be adequate to pay off all remaining claims until their last warranty expires on time.
Builders such as D.R. Horton Inc., Meritage Homes Corp., and M/I Homes Inc. are a big part of the reason for the seemingly consistent and predictable industry average seen in Figure 2. Their claims rates as well as the amount of accruals made per home have been so steady that one might assume they were drawn with a plumb line.
HVAC & Major Appliances
In Figure 3, we've combined the data points for two different groups of manufacturers: Heating/Ventilation and Air Conditioning, and household appliances. One could combine them into one huge group of appliance makers, but this chart illustrates an important difference: the HVAC manufacturers tend to have low claims rates and long warranties, while the appliance makers have high claims rates and short warranties (or at least lightly-funded liability reserves).
Figure 3
HVAC & Appliance Manufacturer Warranties
Claims Rate & Reserves Held by U.S.-based Companies
(as % of sales & months of coverage, 2003-2019)
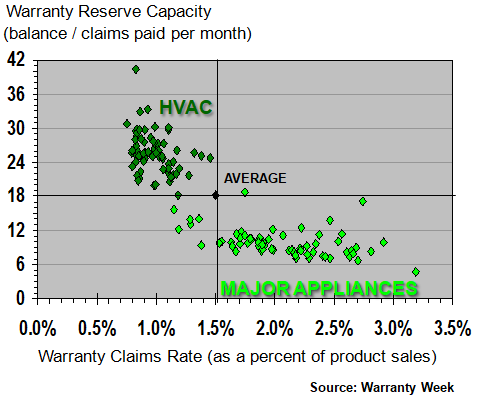
One reason for this apparent difference may be the placement of United Technologies Corp. in the HVAC category. Its Carrier Corp. division's HVAC warranty expenses dominate the conglomerate's warranty expenses, but there's still plenty of aerospace warranty spending within the company. And as we saw in Part 1, aerospace warranties tend to be long and sometimes unpredictable.
But there's help on the way. Once United Technologies completes its merger with Raytheon later this year, it will split into two entities: an aerospace company that includes Raytheon, Pratt & Whitney, and Collins Aerospace, and a building systems unit comprised primarily of Otis Elevator and Carrier. Once that happens, they will have to separate their warranty expenses, and will probably do so retroactively, so we can compare the metrics from 2018 and 2019 as well as from this year.
Whirlpool dominates the major appliance category. And in recent years, its warranty expenses have been somewhat erratic as it absorbed the Indesit acquisition, and all the resulting safety recalls that came with it. But also notice that the group's warranty capacity readings have been much more consistent, between 6 and 12 months for the most part, even if their claims rates have ranged between one and three percent.
Building Material Suppliers
In Figure 4, we're subdividing the suppliers into three additional categories: electrical/plumbing fixtures, cabinets and furniture, and other building materials. The most striking feature of this grouping is the fact that there doesn't seem to be much difference between them, in that all 201 data points seem to be clustered around the same center at 0.7% and 17 months.
Figure 4
Building Material Manufacturer Warranties
Claims Rate & Reserves Held by U.S.-based Companies
(as % of sales & months of coverage, 2003-2019)

There are only minor differences between their specific readings. The fixtures group is centered at 0.74% and 15.9 months. The furniture group is centered at 0.77% and 16.7 months. And the other building material manufacturers are centered at 0.69% and 17.3 months. The claims rate of the furniture group has the highest standard deviation at 0.16%, while the warranty reserve capacity of the makers of other building materials has the highest standard deviation of 4.1 months.
Power Equipment & Material Handling
We have two more industry groups to detail. First, the makers of electrical power equipment -- turbines, generators, solar, wind, and other -- is the subject of Figure 5, below. Dominated by General Electric Co., it also includes the warranty expenses of Valmont Industries Inc., Generac Holdings Inc., SunPower Corp., and First Solar Inc., among others.
Figure 5
Electrical Power Generating Equipment Warranties
Claims Rate & Reserves Held by U.S.-based Companies
(as % of sales & months of coverage, 2003-2019)
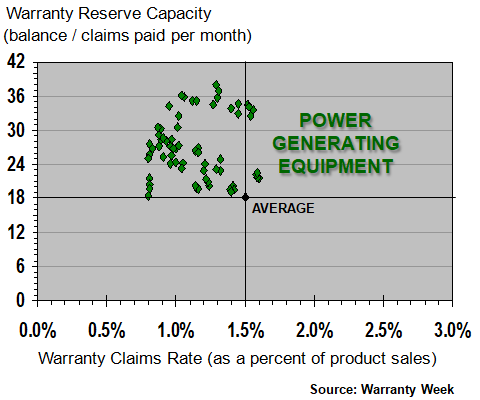
It's clear there is no consensus around the mathematical average of the group, which is centered at 1.1% and 27 months. The standard deviations reflect this, at 0.2% and 5.6 months. At some points their warranty capacity dips to 18 months, and at others it rises above three years. But the bulk of their quarterly claims rates are on the left side of the 1.5% median line.
Oil, Gas & Water Systems
In Figure 6, we're looking at the weighted average warranty metrics of a group of 43 companies such as Baker Hughes Inc., Joy Global (acquired in 2017 by Komatsu), Xylem Inc. (once part of ITT Corp.), Flowserve Corp., and Colfax Corp. Most are engaged in the manufacture of mining or oil/gas extraction equipment, water pumps, steam pipes, valves, compressors, cargo handling systems, or waste handling machinery of some kind -- items that are neither vehicles nor electronics, but aren't quite parts of buildings either.
Figure 6
Material Handling System Manufacturer Warranties
Claims Rate & Reserves Held by U.S.-based Companies
(as % of sales & months of coverage, 2003-2019)
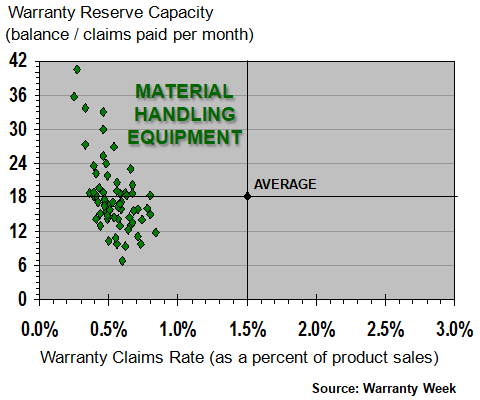
Their warranty metrics are all over the chart, though all the data points are firmly below-average in terms of claims rates. Their average claims rate is only 0.6% -- the lowest of any in this week's roundup. And their warranty reserve capacity is just below 18 months -- the closest to average of the entire bunch. But that latter metric also shows the greatest variability, with a standard deviation of more than 6.3 months.
In other words, the wide diversity of their product lines and the different warranty durations attached to those product lines means that the averages are just numbers. There really isn't a typical ratio between how much they keep in their warranty reserves and how much they spend each month on warranty claims, though their claims rates are almost always under one percent.