Telecom Equipment Warranty Report:
Warranty claims, accruals and reserves rose a bit from record low levels in 2018, but the long-term decline in the telecom network hardware industry continues unabated. Several mergers contributed to the recent increases, while some of the largest industry players continue to increase reliability, cut costs, and drive down their warranty expense rates.
Did you miss the anniversary? On April 30, 1995, the Internet completed its transition from government-funded to commercial status, meaning that the networks that now carry all our email, Amazon.com orders, and Zoom calls are celebrating their silver anniversary. And next month, the Apple iPhone turns into a teenager, making us wonder exactly what did we do to fill up our free time before the coronavirus?
At this point in time, the telecom equipment industry has never been more important, or less important. During this pandemic, we couldn't live without the gear they sell, yet we scarcely think about what runs the networks we now take for granted. And the kids today think of television and radio like we used to think of silent movies and gramophones: like a relic from a different age.
To make a count of the warranty expenses of the telecom hardware industry, we began with a list of 205 U.S.-based companies that manufacture various kinds of network equipment and report warranty expenses associated with their sale. From each company's annual reports and quarterly financial statements, we collected three essential warranty metrics: the amount of claims paid, the amount of accruals made, and the amount of warranty reserves held. We also collected product sales revenue data, and with that plus the claims and accrual totals, we were able to calculate the percentage of sales revenue spent on claims (the claims rate) and the percentage of sales spent on accruals (the accrual rate).
In order to better get a handle on the industry trends, we subdivided the 205 companies into four groups based on their dominant market: Internet and data communications, landline and mobile phone, broadcast and cable television, and satellite & microwave. We assigned 65 companies to the datacomm group; 59 to the phone group, 48 to the TV group, and 33 to the satellite/microwave group.
Annual Claims Totals
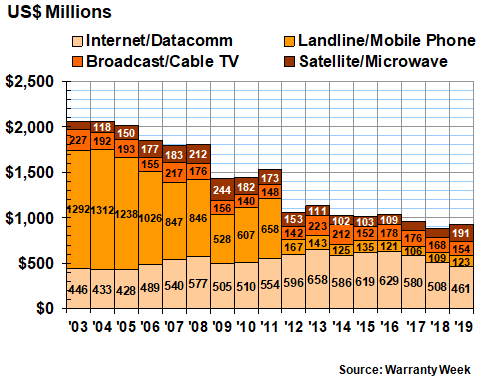
In 2019, the total amount of claims paid by all the companies increased for the first time since 2015-2016. But growth was neither large nor even. The overall total was up by $35 million to $969 million. But while two of the sectors saw increases (datacomm up by $44 million or +6.5% and satellite up by $14 million or +15%), the other two saw decreases (TV down by $21 million or -22% and phone down by $2.3 million or -3.5%).
It was the second year in a row the industry paid out less than $1 billion in claims, after peaking way back in 2006 at nearly $2.2 billion. We should note that this category does not include much consumer electronics such as PCs, TVs, radios, or smartphones. Instead, it is comprised primarily of the network equipment sold to carriers and service providers -- the business-to-business side of the telecom industry. However, some subscriber equipment such as cable boxes and GPS receivers inevitably sneaks in.
Figure 1
Telecom Equipment Warranties
Claims Paid by U.S.-based Companies
(in US$ millions, 2003-2019)
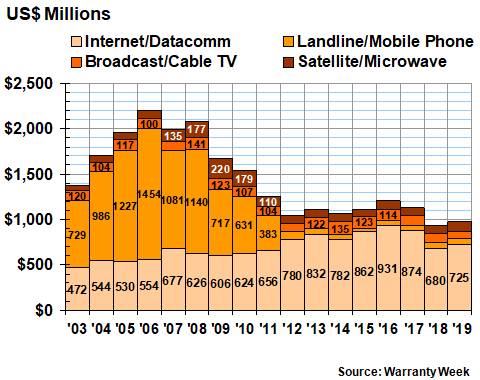
CommScope Holding Company, a cable TV equipment company that acquired Arris International in April 2019, saw the biggest increase in claims. Because of the acquisition, its claims payments more than quadrupled, from $7.4 million in 2018 to $30.4 million in 2019. Cisco Systems Inc., which is by far the largest warranty provider on the entire list, saw a $19 million increase in claims that equated to a 3.2% rise. L3Harris Technologies Inc., the result of a merger between Harris Corp. and L3 Technologies Inc., saw claims double to $28 million.
Among the largest companies in the industry, claims cost reductions were harder to find. Internet equipment maker CalAmp Corp. reduced its claims cost by $4.6 million. Telecom equipment manufacturer Adtran Inc. cut its claims cost by $3.7 million. Data network equipment company Netgear Inc. reported a $2.4 million decrease. Telephone pole manufacturer Valmont Industries Inc. saw a $1.4 million reduction in claims. And GPS equipment maker Garmin Ltd. saw a $1.3 million decrease.
Warranty Accrual Totals
Warranty accruals made by telecom equipment manufacturers also increased marginally in 2019, also from this metric's record low level in 2018. But the increase was only $23 million, or a 2.5% rise to $932 million. And that's far below the 2006 peak of just under $2.3 billion.
As the chart below suggests, most of the decades-long decline came from a virtual disappearance of accruals in the telephone equipment category, falling from nearly $1.5 billion in 2006 to only $39 million in 2017. That's because of the demise of once-huge industry players such as Motorola, Nortel, Lucent, Avaya, and Tellabs, which were either acquired or sold off in pieces more than a decade ago.
Figure 2
Telecom Equipment Warranties
Accruals Made by U.S.-based Companies
(in US$ millions, 2003-2019)
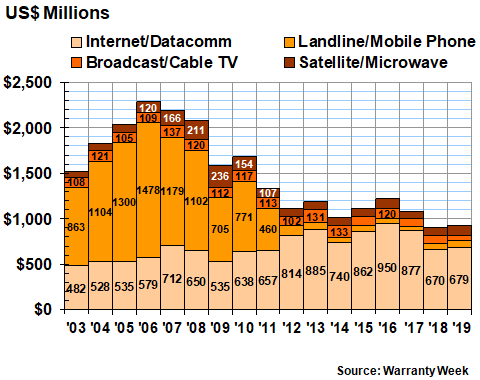
In 2019, Cisco was by far the biggest warranty provider in the industry, accruing more than ten times as much as Garmin, the industry's number two. Both also cut their accruals last year, by $6.0 million and $1.3 million, respectively. There were also big accrual reductions for Netgear (-$5.7 million), Infinera Corp. (-$4.8 million), and Adtran (-$2.8 million).
However, accrual increases were far more common, and also much larger in size. Because of the merger, L3Harris boosted its accruals by $14 million. CommScope and Extreme Networks Inc. each added $12 million. Juniper Networks Inc. increased accruals by $8.3 million. And Plantronics Inc. added $3.1 million.
Though the overall accrual increase was $23 million, that was very much just a net number. The broadcast/cable TV sector actually cut accruals by $21 million. The satellite/microwave group added $15 million. The telephone sector added $19 million. And the datacomm sector, which remains the largest, boosted accruals by $9 million.
Warranty Expense Rates
In Figures 3 through 6, what we've done is to take the claims and accrual totals detailed in Figures 1 and 2 and divide each by the corresponding product sales totals, to produce a pair of percentages. But in each case, and especially to accommodate companies such as Cisco whose fiscal years do not end on December 31, we have made these calculations quarterly. So in each of the next four charts, there are 68 separate pairs of measurements, representing the claims rate (the red line) and the accrual rate (the green line).
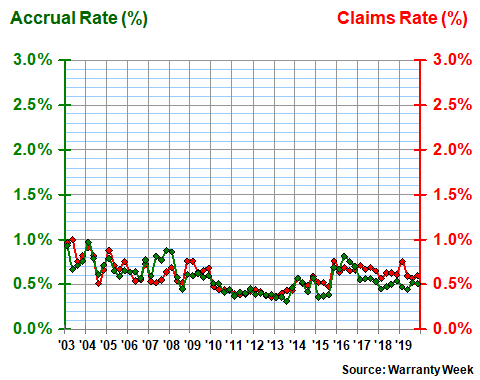
In Figure 3 we're looking at the 65 companies in the Internet and data communications sector. Over the long term, their claims and accrual rates each averaged 1.7% of sales, though they have remained significantly below that level for the past two years. In the fourth quarter of 2019, those percentages sank to 1.4% and 1.2%, with the latter being a new all-time low.
Figure 3
Internet & Data Communications Equipment Manufacturers
Average Warranty Claims & Accrual Rates
(as a % of product sales, 2003-2019)
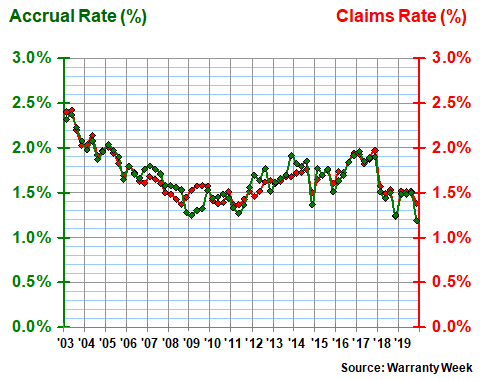
A big reason for the record low was the accrual rate reduction reported by Cisco. At the end of December 2018 its accrual rate was 1.6%. By the end of 2019 it was 1.4%. The other company making a notable reduction was Netgear, which cut its accrual rate from 1.2% to 0.7%. It also cut its claims rate from 1.3% to 1.1%.
In terms of increases, there were several worth noting. Juniper Networks saw its claims rate rise from 1.0% to 1.2%, and its accrual rate rose from 1.0% to 1.4%. Extreme Networks saw its claims rate rise from 2.1% to 2.8%, while its accrual rate rose from 2.2% to 2.9%. Itron Inc. kept its accrual rate unchanged at 0.2% even though its claims rate rose from 0.6% to 1.3%.
Phone Equipment Expense Rates
In the telephone equipment category, Adtran made the most dramatic moves. As its claims rate fell from 1.9% to 1.1%, its accrual rate fell from 1.6% to 1.0%. Ciena Corp. cut its claims rate from 0.8% to 0.7%, but its accrual rate remained at 0.8%. Valmont saw its claims rate notch down from 0.7% to 0.6%, as its accrual rate inched up from 0.5% to 0.6%. And Plantronics Inc. saw both its warranty expense rates rise by 0.1%.
Figure 4
Landline/Mobile Phone Equipment Manufacturers
Average Warranty Claims & Accrual Rates
(as a % of product sales, 2003-2019)
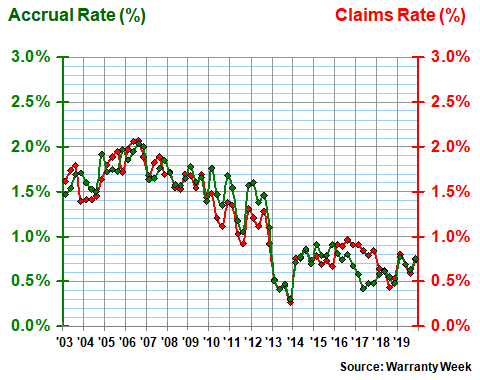
Over the long term, the telephone equipment companies have averaged a 1.2% claims and accrual rate. But the standard deviations are high (at 0.5%), suggesting a high level of volatility in the data, which a glance at Figure 4 more than verifies. Expense rates literally plummeted in 2013, and have never since come near the 0.3% mark they set in the fourth quarter of that year.
In Figure 5, we're looking at the record of the 48 companies in the broadcast/cable TV group. Here, the cost-cutting leader was CalAmp, which took its claims rate down from 2.3% to 0.4%, while cutting its accrual rate from 0.4% to 0.3%. Infinera's claims rate inched up from 2.4% to 2.5%, but it cut its accrual rate anyway, from 3.8% to 2.4%. And CommScope, after acquiring Arris, saw its claims rate more than double while its accrual rate went up by two-thirds.
Figure 5
Broadcast/Cable TV Equipment Manufacturers
Average Warranty Claims & Accrual Rates
(as a % of product sales, 2003-2019)
Of the four groups, the warranty metrics of the broadcast equipment sector are by far the most stable and the least costly. Since 2003, the average claims and accrual rates have been under 0.6%, with a standard deviation under 0.2%. And that's right about where they ended 2019.
In Figure 6, we're looking at the 33 members of the satellite/microwave group. What immediately sticks out is the volatility of the group's data points from 2008 to mid-2011, and the seemingly annual seasonality of the data ever since.
The group's long-term average claims rate has been 1.3%, while its average accrual rate has been 1.4%. Both come with relatively high standard deviations, though not as high as the telephone group.
Figure 6
Satellite & Microwave Equipment Manufacturers
Average Warranty Claims & Accrual Rates
(as a % of product sales, 2003-2019)
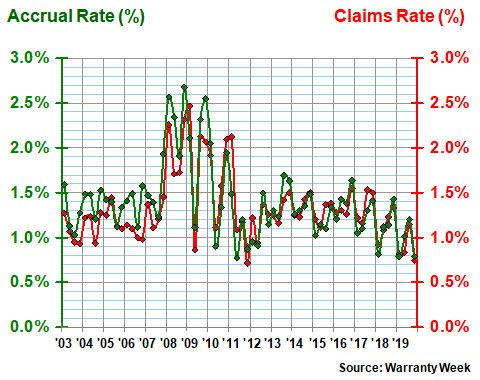
Among the largest members of this group, it's hard to discern a trend. L3Harris saw falling claims and accrual rates, but that had everything to do with the merger, and the fact that L3 Technologies was spending less than Harris on warranty expenses. Comtech Telecommunications Corp. saw its claims rate fall from 0.9% to 0.7%, but its accrual rate remained the same. Orbcomm Inc. saw its claims rate rise from 1.7% to 2.0%, but its accrual rate also remained the same. And ViaSat Inc. saw its accrual rate rise from 0.4% to 0.7%, but its claims rate remained unchanged.
Warranty Reserve Balances
Finally, our last warranty metric is the year-ending balance in the warranty reserve funds of the 205 companies we're following in this industry. Reserves totaled $929 million at the end of 2019, up $49 million since the end of 2018 but once again the second-lowest level of the past 17 years.
Reserves actually fell by $47 million for the data communications equipment companies, driven by a $37 million decline at Cisco, a $7.2 million decline at Itron, and a $3.9 million decline at Netgear. The broadcast equipment companies cut their reserve balances by $14 million, despite the $45 million merger-driven increase reported by CommScope. And the telephone equipment companies actually raised their reserve levels by $14 million.
Figure 7
Telecom Equipment Warranties
Reserves Held by U.S.-based Companies
(in US$ millions, 2003-2019)
But it was the satellite/microwave companies that set the pace, increasing their warranty reserves from $95 million at the end of 2018 to $191 million at the end of 2019. This left enough space to actually insert a data label into the chart -- something that wasn't possible during the two previous years. But, as with the other metrics, the big reason for the increase was the merger that produced L3Harris.
Note that with this metric, as with both claims and accruals, the telephone category nearly disappears after 2011, while the datacomm category slowly rises then falls. Back in 2006, in fact, the telephone sector accounted for two-thirds of all the industry's claims and accruals. By 2019 their share was under 10%.
Meanwhile, way back in 2003, when the commercial Internet was still young, and dial-up America Online service was the bee's knees, data communications equipment generated about a third of the industry's claims and accruals. By 2016 that sector's share was close to 80% of the total.
By the way, before we go, we wanted to let you know that Eric Arnum of Warranty Week and Roshan Pinto of Tavant Technologies Inc. are hosting a half-hour webinar on Friday, May 15, on this very subject of telecom industry warranty metrics. Readers who wish to join in should click here to register, keeping in mind that there's a 1:30pm EDT (1730 GMT) start time.