Appliance Warranty Expense Report:
While the HVAC industry is known for its long warranties and low warranty expense rates, the household appliance industry is known for its volatility. In 2019, claims fell and accruals rose, but the big news is the jump in expense rates seen in early 2020, caused by a recall in Europe.
Unlike the HVAC equipment we looked at in last week's newsletter, the warranty metrics of the manufacturers of household appliances are prone to sudden surges and declines, tied primarily to safety recalls. And unlike the manufacturers of passenger cars and SUVs, which are also recall-prone, the appliance makers do not have a long-term track record of consistently reducing their warranty expenses.
We began with a list of 40 U.S.-based companies that are, or were, primarily engaged in the manufacture of household appliances. But we quickly determined that the largest among them, the General Electric Company, should not be included for two reasons: First, the company exited the household appliance business four years ago, selling that troubled division to the Haier Group, a Chinese company that does not report its warranty expenses, though Haier still licenses the GE name to leverage the brand's reputation for quality. Second, GE reports about as much warranty expenses as the other 39 companies combined, though we know that most of it comes from other product lines such as jet engines and medical equipment. Therefore, we excluded GE this time around, though we recognize that from 2003 until 2016 it was a major part of the appliance industry.
From each of the remaining 39 companies, we gathered three essential warranty metrics from their annual reports and financial statements. We looked for the amount of claims paid, the amount of accruals made, and the amount of warranty reserves held. We also looked for data on the amount of product revenue, and with those numbers, calculated figures both for claims as a percent of revenue (the claims rate) and accruals as a percent of revenue (the accrual rate).
Warranty Claims Totals
In 2019, the amount of claims paid dropped for a rather strange reason. As can be seen in Figure 1 below, the annual total fell from $693 million to $484 million -- a 30% decline. But the main reason was the warranty accounting methodology of Newell Brands Inc., which sells the Coleman, Sunbeam, Rubbermaid, First Alert, Mr. Coffee, and Calphalon brands, among others. The company reports only its opening and closing balances. In 2018, the opening balance was $221 million and the closing balance was $123.3 million, but in 2019, the opening balance was $123.3 million and the closing balance was $123.7 million. Without exact data on the amount of claims and accruals, we had to estimate that both metrics fell significantly last year.
Figure 1
U.S. Appliance Industry Warranties
Claims Paid by U.S.-based Companies
(in US$ millions, 2003-2018)
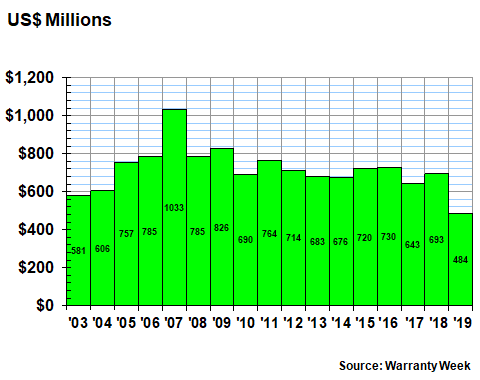
For most other companies, we have complete data. At Whirlpool, claims fell from $294 million in 2018 to $235 million in 2019. Middleby Corp. saw claims rise by $7.7 million, while Welbilt Inc. saw claims rise by $3.4 million.
Warranty Accrual Totals
Warranty Accruals, on the other hand, actually rose significantly last year, to a level of $619 million from $529 million in 2018. That represents a 17% increase -- much faster than a 1.2% rise in product sales revenue. However, as the data in Figure 2 suggests, the anomaly seems to be the big drop from 2017 to 2018, while the 2019 total seems more like a return to normal.
Figure 2
U.S. Appliance Industry Warranties
Accruals Made by U.S.-based Companies
(in US$ millions, 2003-2019)
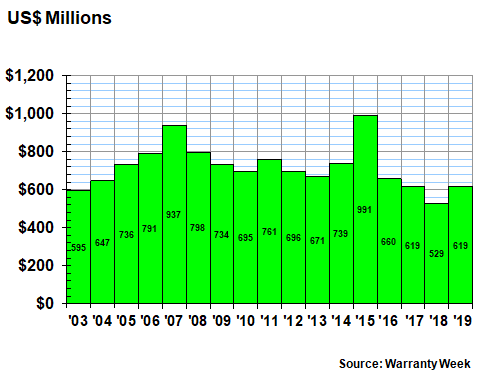
With this warranty metric, the biggest increase was reported by Whirlpool, which saw accruals rise from $289 million in 2018 to $350 million in 2019. But Middleby reported a $6.5 million increase, while Welbilt reported a $2.9 million increase.
Warranty Expense Rates
In Figure 3, we're talking the claims and accrual totals in the previous two charts and dividing each by the corresponding amounts of product revenue. As the shape of the chart suggests, the average claims and accrual rates of the industry have bounced around quite a bit over the past 17 years -- rising from 2003 to 2007, remaining stable from 2011 to 2014, and falling from 2015 to 2019. It would make for a happy ending if not for the sudden spike in the claims rate in early 2020, which came six months after a similar spike in the industry's average accrual rate.
During the first quarter of 2020, the industry's average claims rate rose to 1.5%, a full half of a percentage point higher than it was a year before. That's still a bit below the industry's long-term average claims rate of 1.6%. But as Figure 3 shows, that metric has ranged all the way from 0.5% to 2.8% in years past.
Figure 3
U.S. Appliance Industry
Average Warranty Claims & Accrual Rates
(as a % of product sales, 2003-2020)
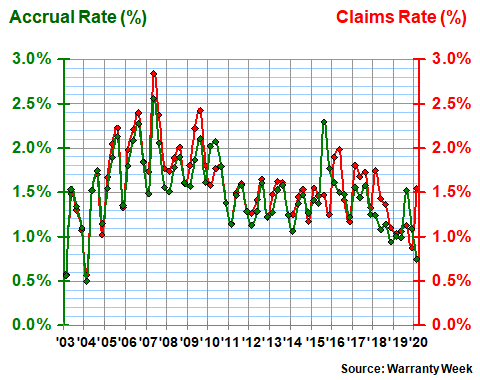
The likely cause of this most recent upturn in expense rates is Whirlpool, which saw its claims rate jump from 1.9% in the first quarter of 2019 to 3.1% in the first quarter of 2020. Meanwhile, the company's accrual rate spiked in the third quarter of 2019, so this rise in claims comes exactly six months later.
However, in Figure 4 below, we can see that this is at least the fourth sudden spike in the company's accrual rate, three of which were accompanied by spikes in its claims rate. And then there are two sudden drops, in late 2004 and late 2005, in both rates simultaneously.
Figure 4
Whirlpool Corp.
Average Warranty Claims & Accrual Rates
(as a % of product sales, 2003-2020)
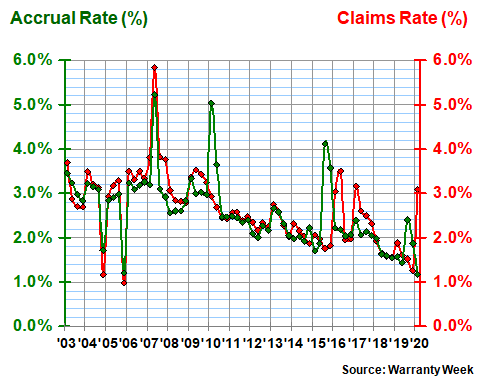
Whirlpool said in its financial statement that this particular spike is related to horizontal axis clothes washers produced by Indesit, a European appliance manufacturer it acquired in 2014. Those washers are now the subject of an ongoing safety recall in the UK and Ireland, it added.
A previous spike in warranty expenses during the second half of 2015 was related to a separate recall of Indesit-made tumble dryers, which allegedly had a habit of bursting into flames. Also, if you can believe it, an Indesit-made refrigerator was blamed for starting the Grenfell Tower fire that killed 72 people in London three years ago.
Warranty Reserves
Our final warranty metric is the closing balance in the warranty reserve funds of the appliance manufacturers at the end of each of the last 17 calendar years. For companies whose fiscal years do not end on December 31, we took the closing balance reported in the quarter that ended in October, November, or December of each year.
In Figure 5, we can see that the industry's warranty reserves rose by nearly 20% to $788 million last year. It was the second-highest year-ending balance in the entire data set, surpassed only by the Indesit-related surge in 2015.
Figure 5
U.S. Appliance Industry Warranties
Reserves Held by U.S.-based Companies
(in US$ millions, 2003-2019)
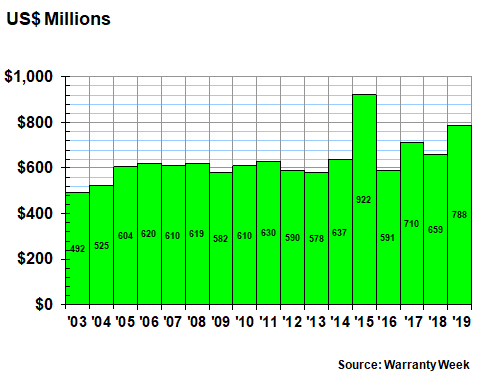
Whirlpool accounted for the bulk of the increase, with its warranty reserves growing from $268 million at the end of 2018 to $383 million at the end of 2019. Middleby saw a $6.9 million increase, and Welbilt saw a $4.2 million increase.
John Bean Technologies Corp., which manufactures an assortment of both food service equipment and airport vehicles, was one of the few to report a decline in warranty reserves. Its balance fell from $13.5 million at the end of 2018 to $12.0 million at the end of 2019.