Truck, RV & Car Warranty Snapshots:
The pandemic lockdowns hit the consumer vehicle makers hardest, and the farm equipment makers the least, as one would expect when commuting to the office is forbidden and food becomes an essential business. The good news is that the downturn may have hit bottom in the second quarter, with third-quarter data pointing towards a V-shaped recovery, as both sales and warranty accruals rise proportionally for many companies.
Many of the top U.S.-based manufacturers have now delivered their quarterly financial reports containing their third quarter warranty metrics, so we thought we'd take an early look at the results.
Given that the automotive sector seems to have been so hard-hit by the pandemic, we decided to look at three top passenger car and light truck manufacturers; three top construction and farm equipment manufacturers; three top on-highway truck manufacturers; and three top recreational vehicle manufacturers.
From each company, we collected three metrics: the amount of claims they paid, the amount of accruals they made, and the amount of product sales they reported. Using the claims, accruals, and sales data, we also calculated the percentage of sales that went towards paying claims (the claims rate), and the percentage of sales that went towards accruals (the accrual rate).
The early picture that emerges is one of a modest recovery from what now looks to be the bottom of the downturn caused by the pandemic: the second quarter of 2020. In the third quarter, these 12 vehicle manufacturers paid out $226 million more in claims than they did during the second quarter, and set aside $1.42 billion more in accruals than they did during the months of April, May, and June 2020.
As we've detailed in past newsletters, claims didn't fall as much and therefore don't need to rise as much as accruals, because of numerous factors. Primarily, claims arise from past sales, and past sales were good. Secondarily, there's a lag time between when sales bottom out and when claims do so, stretching to years in the vehicle sector. Third, vehicle owners tend to postpone replacements and prioritize repairs and maintenance when business deteriorates. And fourth, dealers tend to look harder for things to fix during a downturn, relying more on warranty work when sales revenue falters.
Therefore, while we will mention some of the totals and averages for warranty claims, we will focus more on the recent accruals of these 12 companies. Let's begin with a look at the three top American passenger car and light truck manufacturers: Ford Motor Company, General Motors Co., and Tesla Inc.
Passenger Car Accruals
In Figure 1, we can see that their accruals are on the rebound, although they rose so sharply in the third quarter that it's somewhat hard to see the spike. Ford increased its accruals to $1.166 billion in the third quarter, up from $756 million in the same period a year ago. GM reduced its accruals to $772 million in the third quarter, down from $857 million a year before. And Tesla raised its accruals to $175 million, from $138 million in the same months of 2019.
Figure 1
Passenger Car Warranties
Accruals Made by Top U.S.-based Manufacturers
(in US$ millions, 2003-2020)
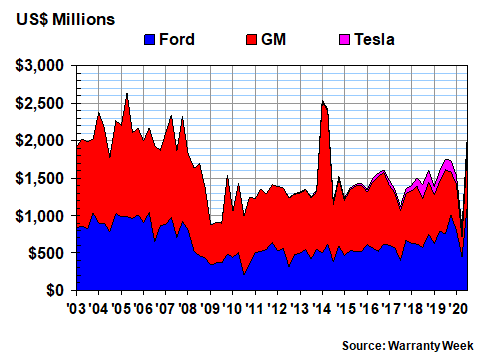
Ford's automotive revenue was actually up by 2.3% in the third quarter of 2020, while GM's was up by 0.8%. Neither of those metrics agrees with the changes in their accrual totals, which were +54% for Ford and -10% for GM. Tesla, however, saw a +43% gain in sales and a +27% gain in accruals, which we'll accept as a vague agreement of the metrics.
Ordinarily, absent a big change in product quality or repair cost, accruals and sales rise and fall proportionally. Therefore, since that didn't happen for either Ford or GM, there must have been a big change in product quality or repair cost.
For Ford, it also doesn't work itself out over a longer period, but it does for GM. For the first nine months of the year, Ford's accruals are up +11% while its sales are down -24%. GM's accruals are down -24% for the year to date, but its sales are down -22% over the same period. And for Tesla, for the first three quarters of the year, accruals are up +2.5% while product sales are up 23% (we're also counting its residential battery sales for this metric).
Notably, Ford has also made an extra-large $1.45 billion change of estimate adjustment this year, raising its accruals for past-year sales. This is what manufacturers must do when their past-year predictions of warranty costs prove to be too optimistic, given actual costs. Tesla, meanwhile, made a downward -$26 million change of estimate during the third quarter, after making a +$9 million upward adjustment during the second quarter, and no adjustments during the first quarter.
Tesla's Accrual Adjustments
The company has suffered from blistering criticisms in the past -- mainly from short sellers -- of its warranty accruals and adjustments. Just to clear the air, we present to you a chart of both their actual accrual rate and the accrual rate after adding or subtracting those adjustment each quarter.
For instance, with $175 million in accruals and $7.925 billion in product revenue, Tesla's accrual rate is 2.2% for the third quarter. But subtracting the -$26 million adjustment from the accrual total and recalculating yields a 1.9% adjusted accrual rate for the quarter. Do that 30 more times for all the quarters since 2013 and you'd get the blue line in Figure 2.
Figure 2
Tesla Inc.
Average Claims & Accrual Rates
(% of product revenue, 2013-2020)
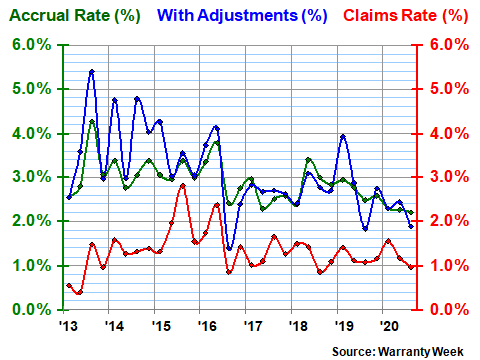
The company's claims rate, meanwhile, slipped under 1.0% again during the third quarter. That's a problem for the short sellers, because half of them are saying the company's warranty costs are wildly out of control, while the other half are claiming there's some sort of falsification of the numbers. We cannot find evidence of either.
Heavy Equipment Accruals
In Figure 3, we're looking at the warranty metrics of three top U.S.-based farm and construction equipment makers: Deere & Co., Caterpillar Inc., and AGCO Corp. Though less dramatic than downturn in the passenger car accrual totals, there was a dip in the second quarter. And sure enough, there's a slight upturn in the third quarter numbers.
Figure 3
Construction & Farm Equipment Warranties
Accruals Made by Top U.S.-based Manufacturers
(in US$ millions, 2003-2020)
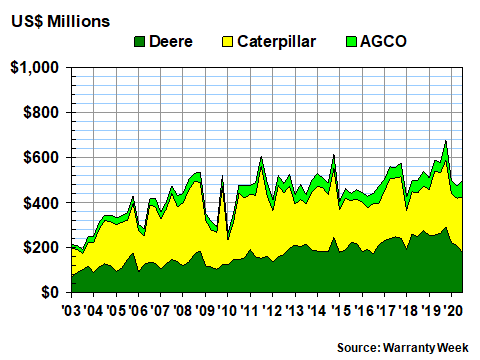
Deere shows the most visible change in the chart above. Its accruals were down -33% in the third quarter and were down -21% for the first nine months of 2020. Sales have fallen -12% for the year so far, which we'll say is approximately proportional.
Warranty costs at AGCO, meanwhile, are up, as are sales. Warranty accruals rose +56% for the quarter and +28% for the year to date, while sales are up +18% for the first nine months of 2020. So again, the metrics are increasing more or less proportionally.
At Caterpillar, accruals are down -7.1% for the third quarter and are down -11% for the nine months, while product sales are down -26% for the year so far. And so, although it's not exactly a proportional decline, it's close enough.
Truck Accruals
In Figure 4, we're looking at Cummins Inc., a top diesel engine manufacturer; Paccar Inc., the parent company of truck brands such as the Kenworth, Peterbilt, and DAF; and Navistar International Corp., a top manufacturer of trucks, buses, and diesel engines.
The most striking feature in the chart is the sudden and short-lived spike in the accruals reported by Cummins in the third quarter of 2018. Because of what we'll call challenges complying with diesel engine emission regulations, the company accrued $571 million in that quarter two years ago. But we're comparing this year to last year, so things seem more under control.
For the first nine months of 2020, Cummins reported making $304 million in warranty accruals, a -16% decline from 2019 levels. Sales are down -22% for the same period. However, accruals for just the third quarter of 2020 are up by +42%, while net sales are down -11%. So that's not at all proportional.
Figure 4
On-Highway Truck Warranties
Accruals Made by Top U.S.-based Manufacturers
(in US$ millions, 2003-2020)
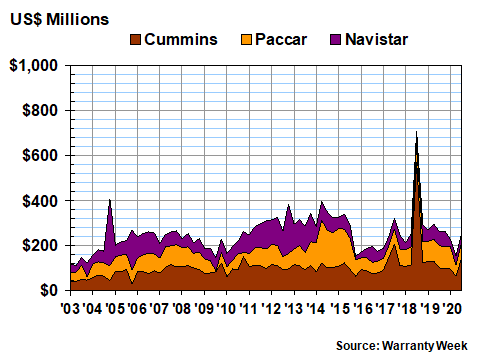
At Paccar, accruals are down -25% for the year so far while sales are down -36%. At Navistar, accruals are down -38% for the year to date while sales are also down by -36%. And we note that the bulge in accrual costs that we saw with Navistar from 2011 to 2013 and with Paccar in 2014 and 2015 are now long behind them. But there is a definite downward notch in the second quarter 2020 data -- not as deep as the passenger car downturn but much deeper than the relatively mild decline in the heavy equipment chart.
RV Warranty Accruals
Finally, in Figure 5, we're looking at three of the top U.S.-based recreational vehicle manufacturers: Thor Industries Inc., Winnebago Industries Inc., and Rev Group Inc. The Rev Group didn't begin reporting its warranty expenses until 2015, so there's data for only two companies for most of the time. But there does seem to be a significant notch in the second quarter 2020 data.
Figure 5
Recreational Vehicle Warranties
Accruals Made by Top U.S.-based Manufacturers
(in US$ millions, 2003-2020)
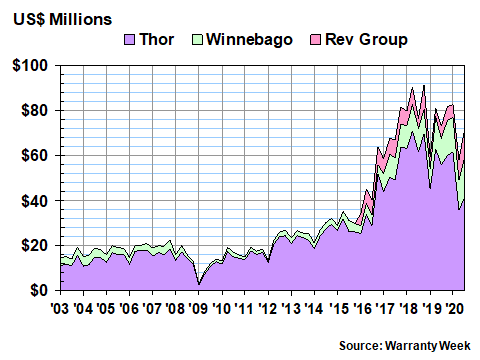
Thor ends its fiscal year on July 31, while Winnebago ends its fiscal year on August 29. The Rev Group, meanwhile, ends its fiscal year on October 31. Since we're doing quarterly measurements, that difference in timing usually doesn't matter much. But this year, the first wave of the pandemic and its lockdowns crested in March, April, and May. So whichever quarter contains those months is going to have the worst comparables.
For the fiscal years, however, Thor's accruals are down -15% while its sales actually rose by +3.9%. Winnebago's accruals were up by +35% while its sales were up +19%.
Rev Group's annual report won't be out until mid-December, so we will have to settle for nine-month comparisons: accruals up +88% while sales are down -5.1%. The problem is the report for the quarter that included the months of May, June, and July: accruals more than doubled from $5.4 million to $12.7 million, while sales fell by -5.6%.
From worst to best, the drop in second quarter sales and warranty costs seems to be cars, RVs, trucks, and heavy equipment. We think there's a pattern in those rankings, namely, their relative exposure to locked-down consumers. Car buyers couldn't leave the house. RV buyers couldn't leave the state. Truck fleet operators, at least if they were carrying food, were considered to be essential workers. And while many construction sites were shuttered for a while in the spring, throughout the growing season farmers did what farmers do, in spite of the virus.