July 16, 2008 |

|
ISSN 1550-9214 |
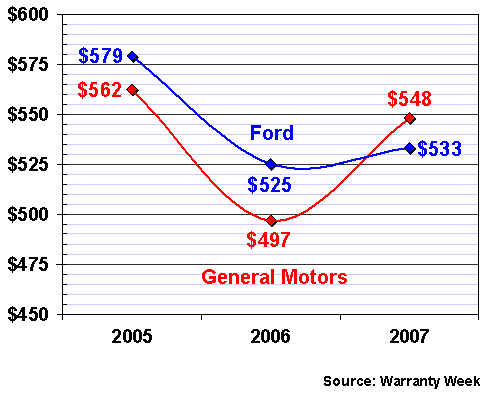
Warranty Cost per Vehicle:If one has a figure for warranty accruals and for annual sales, one can quickly calculate an estimate of what a given automaker expects to spend on warranty claims over the life of its vehicles. And better yet, all the complexities of warranty durations, local currencies, labor and parts cost are built into the estimate.A subscriber asked a simple question for which there should be a simple answer: What is the average claims cost per vehicle for the major automotive manufacturers? He had just come across an old article on claims cost per vehicle (Warranty Week, Jan. 27, 2004 ) that found the Detroit Three paying roughly twice as much in claims per vehicle as did the Japanese imports, and he wanted to know if that was still true. Unfortunately, there is no simple answer. To derive figures for claims cost, first one has to estimate the different average warranty duration for vehicles sold in North America, Europe, Asia, and elsewhere. And then one has to combine those estimates with sales figures to estimate how many vehicles are under warranty at any given moment. One also has to estimate how many vehicle warranties expire on mileage versus time. For manufacturers such as DaimlerChrysler AG and Honda Motor Co., one also needs to estimate the average warranty cost not only for passenger cars and light trucks, but also for heavy trucks, motorcycles, and even portable generators. That's the only way to figure out how much is being spent on cars, vans, SUVs and pick-up trucks. And then there's the added cost of longer powertrain warranties, which in some cases can last as long as the car is owned by the original buyer. And finally, one has to make some choices regarding which exchange rate to use for dollars, euros, and yen. Should it be the annual average? Or should it be the rate at the end of each quarter? The year-end figure? With all the recent gyrations in currency values, the claims cost of an export over the three-or four-year life of its warranty could rise or fall significantly based on that factor alone. Assumptions Built Into Their EstimatesThe good news is that many of the automakers have done this work for us. We don't need to know how long their warranties are because they know this at the time they estimate their warranty accruals. Before they decide how much to set aside as a warranty accrual when they sell a given vehicle, they have to consider factors such as warranty duration, product quality, local repair costs, and how many warranties will expire on mileage before their time is up. They have to estimate the future claims cost per unit at the time of sale, and add that amount into their warranty reserve funds. The figures the automakers report for warranty accruals each year are an amalgamation of all these estimates. Is one nameplate generating more warranty work than another? That difference will be built into the accruals. If SUV One is expected to generate $500 in warranty costs over the life of its warranty, and Manufacturer A sells a thousand of them, the company will set aside $500,000 in its warranty reserve fund. And if Sedan Two is expected to generate only $250 in warranty cost per vehicle, and Manufacturer A sells two thousand of them, it will add another $500,000 to the reserve fund. Of course, the automakers would never reveal which of their nameplates generate the most warranty costs. In fact, they're dead set against the public release of warranty data now collected by the U.S. National Highway Transportation Safety Administration as part of the TREAD Act. But if Manufacturer A reveals to one government agency that it sold three thousand vehicles (SUVs and sedans) and tells another government agency that it accrued one million dollars for their predicted warranty costs, it's a rather straightforward process to figure out an average per-vehicle accrual rate of $333. It turns out that General Motors Corp., Ford Motor Co., DaimlerChrysler, Honda and Toyota Motor Corp. each separately report both their annual sales figures and their annual warranty accruals. In terms of units sold, these five (or six) companies have an estimated 77% market share in the U.S. and a 46% share of the worldwide market for passenger cars, vans, and light trucks. So it's a rather straightforward process to figure out the expected warranty costs for more than three-quarters of the vehicles sold in the U.S. and almost half the vehicles sold in the world. General Motors FirstLet's start with General Motors. Now that the company has spun off its locomotive division and because its primary product line is comprised of passenger cars and light trucks, the calculations are rather straightforward. GM reported $5.14 billion in accruals in 2007 and sold 9.37 million vehicles worldwide, suggesting an accrual rate per vehicle of $548. Ford Motor Co., meanwhile, reported 6.55 million vehicles sold in 2007, including the Jaguar and Land Rover brands. Excluding those nameplates, Ford reported $2.9 billion in warranty accruals for 2007. Adding in a $600 million estimate for accruals made by Jaguar and Land Rover, we've adjusted that figure upwards to $3.5 billion. Using that higher figure results in a calculation of $533 for accruals per vehicle. The corresponding estimates for GM and Ford in 2006 are $497 and $525 per vehicle, which means that the accruals per vehicle have increased for both companies. At GM, the average revenue per vehicle was unchanged, which means the accrual rate took a slight jump. At Ford, however, we're estimating an 8.4% increase in revenue per vehicle sold, so the accrual rate took a slight dip. Back in 2005, we're estimating a per-vehicle accrual for GM of $562 and a per-vehicle accrual at Ford of $579. We're also estimating a worldwide average revenue per vehicle for GM of $17,500 for 2005, as opposed to $22,500 for Ford. Therefore, the accrual rate for Ford was 2.6% in 2005 while at GM it was 3.2%. If those figures sound off, keep in mind that only 7.5% of Ford's unit sales and 5.4% of its revenue that year came from the Asia/Pacific region while 37% of its unit sales and 42% of its automotive revenue came from Ford Europe and the Premier Automotive Group. Prices tend to be higher in Europe and lower in Asia/Pacific. At GM, Europe accounted for 22% of unit sales in 2005 and Asia/Pacific accounted for 28%. In addition, GM has a strong market share in markets such as Brazil, Venezuela, and Colombia. So the product mix is stronger for GM in low-priced markets and weaker in high-priced markets. Figure 1 | ||||||||||||||||||||||||||||||||||||||||||||||||||||||||||||||||||||||||||||||||||||||||||||||||||||||
| ||||||||||||||||||||||||||||||||||||||||||||||||||||||||||||||||||||||||||||||||||||||||||||||||||||||