Automotive Warranties:GM and Ford are cutting their warranty expenses and closing the gap with both their competitors and their suppliers. And it's beginning to get some notice in the daily newspapers. Truck makers aren't as lucky, but their year-ago figures weren't as dreadful.
Has the Detroit-based automotive industry finally turned the corner? Are recent sales increases a response by customers to improved quality?
The June 1 headline in the Detroit News declared, "Warranty claims fall for Big 3." The article went on to state that "Detroit's Big Three have slashed warranty claims more than 40 percent in recent years -- further evidence that the automakers, long plagued by repair problems and consumer perceptions that their products are inferior, are narrowing the quality gap with foreign competitors."
We won't have any new warranty data from Honda or Toyota until late June, but two of Detroit's Big Three have already reported their warranty expenses for the first quarter, as have most of their suppliers. And it does appear that the automotive OEMs are cutting warranty costs and closing that gap, not only with their Japanese competitors, but also with their suppliers.
Closing the Gap
For multiple years, U.S.-based auto OEMs have spent an average of 2.5% of their product revenue on warranty claims. Toyota and Honda have generally been in a 1.0% to 1.5% range. U.S.-based automotive suppliers have averaged 0.6% to 0.7% of their revenue spent on warranty claims.
But then last year, sales went south and claims went north. Companies were fixing 2008's products with 2009's (diminished) revenue, so the claims rate soared above 3.0% for the OEMs and close to 1.0% for the suppliers.
We won't know where Toyota and Honda spent the year until they file their annual reports later this month. But even a year ago, Toyota had seen its claims rate rise noticeably. One can only imagine what its claims rate will be after recent calamities. But Ford's claims rate was 2.0% on March 31, 2010, and Toyota's claims rate was 1.8% a year before that, so it's possible they've intersected in the past few months.
As can be seen in Figure 1 below, U.S.-based auto OEMs have seen their average warranty claims rate plummet to an average of 2.3% in the first quarter of 2010. And their average accrual rate, which never really soared last year (it's less susceptible to sales fluctuations) has now declined to 1.75%.
Figure 1
All Automotive OEMs
Average Warranty Claims & Accrual Rates
(as a percentage of product sales, 2003-2010)
For both rates, the first quarter 2010 measurements are the lowest they've ever been for U.S.-based auto OEMs, at least since public disclosures of warranty expenses became a required part of all quarterly and annual reports in 2003. And that's worth celebrating.
There are multiple ways to measure the decline. Figure 1 measures warranty claims and accruals as a percentage of revenue. But we could also measure the claims and accruals in dollars alone. And we could also measure the total warranty reserves being held in anticipation of future claims.
In the first quarter of 2010, U.S.-based automotive OEMs spent just over $2 billion on warranty claims worldwide. In the first quarter of 2009, the total was $2.3 billion. In the same quarter of 2008, the total was $2.9 billion. And in the first quarter of 2007, it was $2.8 billion.
In the first quarter of 2010, U.S.-based automotive OEMs set aside only $1.5 billion in warranty accruals. That was actually up a bit from the $1.4 billion set aside in the recession-depressed first quarter of 2009, but was down considerably from the $2.5 billion figure in 2008 and the $2.7 billion figure in 2007.
Supplier Recovery Efforts Pay Off
It would be wonderful if OEM warranty costs declined, quality rose, and that was the end of the story. But the complete picture has to include the suppliers, who have seen their warranty costs rise above their typical 0.6% to 0.7% range up to 0.8% and even 0.98% in one quarter last year. The reported warranty figures are net numbers, so when a supplier reimburses an OEM, the latter's figures decline while the former's figures rise.
The moral of the story is that some of the OEMs have lately become better at shifting some of their warranty costs to their suppliers. So that gap is closing too. While the gap was as wide as 2.4% in early 2009 (when the OEM claims rate was 3.3% and the supplier rate was 0.9%), it's now only 1.4% (after the OEMs declined to 2.3% and suppliers stayed the same).
We don't exactly want to portray the suppliers as victims here, but it is worth noting that the suppliers' gain is part of the reason for the OEMs' decline. It's not all quality gains. Then again, there's nothing inherently unfair about OEMs making the supplier who allegedly caused a failure pay its cost. It's just that the OEMs never were very good at it until recently.
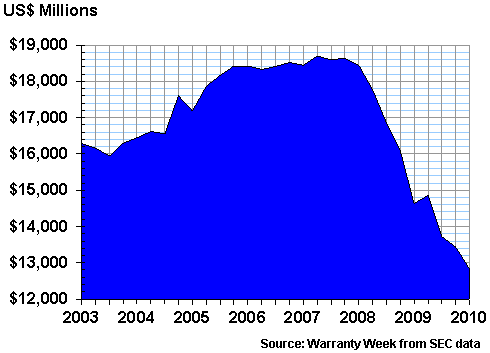
In terms of warranty reserves, the balance at the end of March 2010 was the lowest ever observed for the automotive OEMs. The total reserve balance was $12.8 billion at the end of March 2010, as opposed to $14.6 billion at the end of March 2009, $18.5 billion at the end of March 2008, and $18.5 billion at the end of March 2007. As can be seen in Figure 2, the peak came in June 2007, when the collective balance of the OEMs topped $18.7 billion.
Figure 2
U.S.-based Automotive OEMs
Warranty Reserve Balances, 2003-2010
(in US$ millions)
There are a few automotive OEMs that aren't part of the recent statistics, for one reason or another. For instance, Fleetwood Enterprises is still trying to emerge from bankruptcy. Monaco Coach was sold off in pieces. And Arctic Cat hasn't yet filed its annual report for the fiscal year ended March 31, 2010. But their contribution wouldn't have moved the numbers much, especially when compared with the passenger car and heavy truck manufacturers.
Ford and GM are of course two of the biggest warranty providers across all industries, and they're counted here as the two largest auto OEMs. But there are also numerous manufacturers of trucks and buses, vocational vehicles, sports vehicles, construction vehicles and farm equipment in the data. And while the recession was brutal across the board, it wasn't as deep in the business-to-business sector as it was in the consumer sector (and it was deeper for leisure/luxury vehicles than for everyday commuter cars).
Missing Data from Chrysler
The one company we wish we had data for is Chrysler Group LLC. From 2003 to 2006 their warranty data was part of Daimler's financial reports. In 2007 and 2008 the company was privately held, and therefore made no reports. And then in 2009 the company went bankrupt and changed its name to Old Carco LLC. In 2010, we hope to hear from the new Chrysler by way of Fiat's financial reports, but we fear they'll find yet another way to keep their warranty accounting out of the public domain for another year.
The Detroit News said Chrysler's warranty claims were down 48% in the past two years, according to internal warranty data. The newspaper also said that Chrysler's warranty cost per unit sold was reduced by a total of $240 million in 2008, but again the source of that data was the company itself. And there were no before or after figures supplied -- just the size of the reduction.
But welcome back General Motors! Even though the company is owned by its unions and the governments of Canada and the U.S., it still managed to resume filing quarterly and annual reports as the General Motors Company. The data in Figure 3 also includes warranty spending by its predecessor, the General Motors Corp. (which later became Motors Liquidation Company). And there's still a gap in the data from the second quarter of 2009, when that transition was under way.
Figure 3
General Motors Co.
Warranty Claims & Accrual Rates, 2003-2010
(as a percentage of product sales)
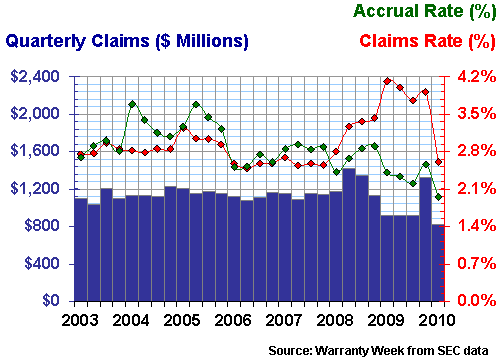
The Detroit News reported that warranty claims at GM have fallen 45% from 2007 levels. But our data shows that GM spent $4.54 billion on claims in 2007 and $4.08 billion in 2009 -- a 10% reduction. We suspect the newspaper mixed up claims and accruals, because GM's accrual total did indeed fall 48%, from $5.14 billion in 2007 to $2.67 billion in 2009.
Look at the Accrual Rate
We'd suggest, however, that declining sales had more to do with those reductions than any increase in quality. If you're in search of increasing quality, look at the accrual rate as a percentage rather than accruals in dollars. That would be the green line in Figure 1 and in Figures 3 through 8.
If product quality and average repair costs remain the same, the accrual rate should also remain steady. In other words, if the predicted future repair cost of a $20,000 car is calculated to be $500 per vehicle, the accrual rate will remain 2.5% whether they sell a hundred or a million units. But if either the frequency or the severity of repair costs declines, the accountants might find reasons to justify a reduction in accruals to $400 per unit. And then the accrual rate would be $400 / $20,000 = 2.0%.
A really good example of this can be seen at the Ford Motor Company. In Figure 4, it's clear that the green line has been declining for multiple years, though it crept back up slightly in the first quarter of 2010. But in the second half of 2009, it was the lowest it's ever been: 1.47% of sales.
Figure 4
Ford Motor Co.
Warranty Claims & Accrual Rates, 2003-2010
(as a percentage of product sales)
The red line -- that's what happens when sales fall off a cliff. Pay no attention to a rising claims rate in a deep recession. Claims soar, because you're fixing last year's models with this year's money. The claims rate could soar even if claims declined, because sales declined faster. But the accrual rate shouldn't decline unless quality is increasing and/or the cost of warranty work is decreasing.
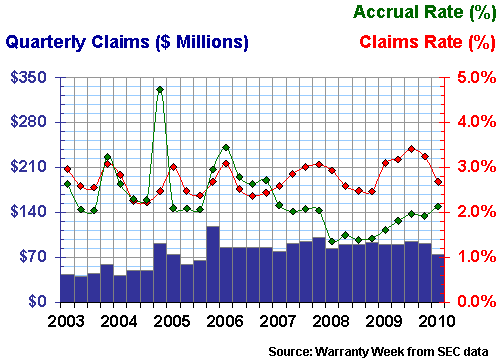
We mention the latter because sometimes the cost of warranty work can be reduced artificially, as when Navistar and Ford sparred through lawsuits over diesel engine repair costs a couple of years ago. Navistar simply stopped paying Ford, and both claims and accrual rates dropped. When they settled the lawsuits, the money that changed hands was not counted as warranty work.
At Navistar, the accrual rate is now back up to the 2.0% level that it touched in 2003, 2005, and 2007. Figure 5 shows it falling as low as 1.36% in early 2008. The claims rate, meanwhile, remains in the same range as it has over most of the past seven years.
Figure 5
Navistar International Corp.
Warranty Claims & Accrual Rates, 2003-2010
(as a percentage of product sales)
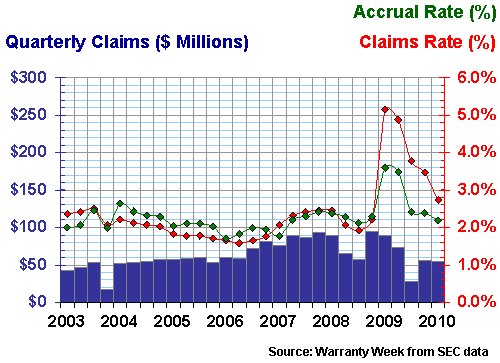
At Paccar, there's also a recent return to normalcy under way. Whatever went wrong a year ago -- and nothing was announced publicly -- is becoming a distant memory. As can be seen in Figure 6, claims are back down to 2.7% while accruals are back down to 2.2% of revenue.
Figure 6
Paccar Inc.
Warranty Claims & Accrual Rates, 2003-2010
(as a percentage of product sales)
There are some 27 or so U.S.-based automotive OEMs reporting warranty expenses, and while we could profile them all, we'll defer that exercise to a later date. Suffice it to say that the declining trend evident at the passenger car OEMs was more elusive at the heavy truck level.
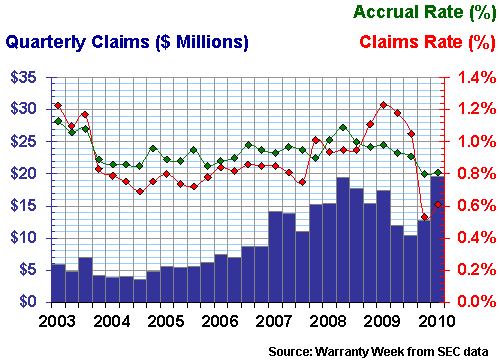
But we did find one heavy truck OEM that has seen its accrual rate decline for two years. Oshkosh Corp., which makes garbage trucks, tow trucks, fire engines, construction equipment and military vehicles, has cut its accrual rate from 1.1% in early 2008 to 0.8% in early 2010.
Figure 7
Oshkosh Corp.
Warranty Claims & Accrual Rates, 2003-2010
(as a percentage of product sales)
The blue bars in Figure 7, which represent the warranty outlays in dollars, have not declined, however. In the first quarter of 2010, Oshkosh paid out a record $19.7 million in warranty claims. Yet its claims rate was only 0.6%. How could this be?
The reason is increasing sales. Oshkosh has seen a 98% increase in sales in the first half of its latest fiscal year. So it has an expanding pool of funds with which to pay for repairs of last year's sales. It's the exact opposite of the recession-driven soaring claims trends seen in Figures 1, 3, 4 and 6.
Finally, we just recently reported on service contracts for motorcycles, so we thought we'd end with a snapshot of the leading U.S.-based motorcycle manufacturer.
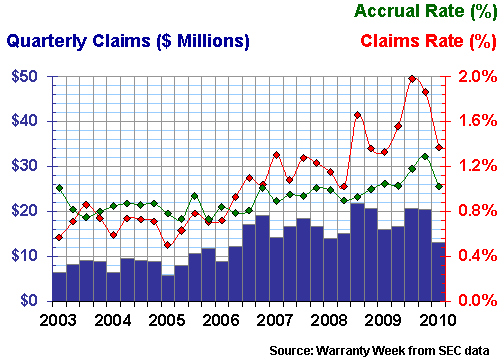
In the past year, Harley-Davidson has seen a 20% decline in vehicle sales revenue, an 18% decline in claims, and a 22% reduction in accruals. The result is a claims rate that rose from 1.3% to 1.4% and an accrual rate that remained flat at 1.0%, compared to a year ago.
Figure 8
Harley-Davidson Inc.
Warranty Claims & Accrual Rates, 2003-2010
(as a percentage of product sales)
There's a bit more to the story, however. Last summer, in the depths of the recession, Harley's claims rate almost touched 2.0%, and the company responded by raising its accrual rate to 1.3% in the fall. As a result, Harley now has more than $70 million in its warranty reserve fund, and may at some point want to take some of that out and send it to the bottom line (unless there really is a quality problem lurking, rather than a recession-induced spike in claims rates).
Freed Up Capital
For that's the real story behind the massive recent decline in reserves pictured in Figure 2. All those billions which weren't set aside in warranty reserve funds during the past two years were used to either reduce losses or boost profits. Rising quality reduced warranty costs and freed up billions of dollars for other uses. And that's a manufacturing story worth celebrating.
| 


