Warranty Accruals per Vehicle: Multiple readers said something wasn't quite right with the warranty data in last week's newsletter. So this week we're diving into the deep end, probing to see if it's possible for both accruals and prices to fall as fast as the math says they are.
The improvements shown in warranty accrual rates by some of the major automotive OEMs in last week's newsletter were called into question by numerous readers. The numbers were changing too fast for all of the cost reductions to be caused by quality gains, they said.
Readers wrote in with four main concerns:
- That GM's and possibly Ford's per-unit prices sounded too good to be true,
- That the Honda per-unit data, and possibly BMW's also, were skewed by motorcycle sales,
- That the cost cuts which we suggested were evidence of quality gains by the OEMs were merely evidence of increased reimbursements by their suppliers, and
- That GM simply accrued less than was necessary to cover future warranty costs.
We will examine each of these concerns in detail.
In last week's newsletter, we stayed as close as possible to the actual data published by the companies themselves in their annual reports. In this week's follow-up, in order to provide the details necessary to address these concerns, we're going to make assumptions and include estimates that may or may not be accurate. Readers are welcome to modify the models and arrive at their own estimates.
Prices Too Low?
So let's start with a look at the per-unit pricing of General Motors cars. Last week's newsletter didn't include this data, but a reader said the figures that were included led him to believe that GM's per-unit revenue for 2009 cars was an unlikely $13,923.
We'd been figuring the warranty accruals per unit by taking the total accruals made in 2009 ($2.667 billion) and dividing it by the number of units sold (7.478 million). Our math was correct: $357 per vehicle. But so was his: only $13,923 per vehicle, based on the $104.116 billion in automotive revenue reported by both "Old GM" and "New GM" during the year.
We repeated the same calculations for 2008 and 2007, and Figure 1 is the result. The green line and the left axis track accruals per vehicle. The brown line and the right axis track the revenue per vehicle.
Figure 1
General Motors Worldwide
Average Unit Price &
Warranty Accruals per Unit, 2007-2009
(in US dollars)
The 2009 accrual rate of 2.56% follows directly from the fraction produced by dividing $357 by $13,923. We omitted the per-unit prices for 2008 and 2007 from the chart, but if we told you GM's accrual rates were 2.90% in 2008 and 2.88% in 2007, you'd be able to calculate that the figures were $17,680 and $19,018, respectively.
So that 2009 figure of only $13,923 per unit does seem to be something of a problem. How could that low number be an average for a vast product line like GM's? Even the Chevrolet Cobalt is hard to find selling for under $15,000. And how could the per-unit price drop so fast in 2009?
It's All About China
Our proposed answer is it's not about the U.S. at all. Instead, we suspect that it's China -- where prices are low and warranties are brief -- that's pulling down the averages.
Yes, U.S. unit prices are also falling, but not as fast and not as low as they are in China. And here's where we leave the actual data and begin with the estimates. We're going to assume that every nameplate in GM's product line had a 2.56% accrual rate last year. We know that's not true, but we'll leave it to readers to alter that assumption in the model.
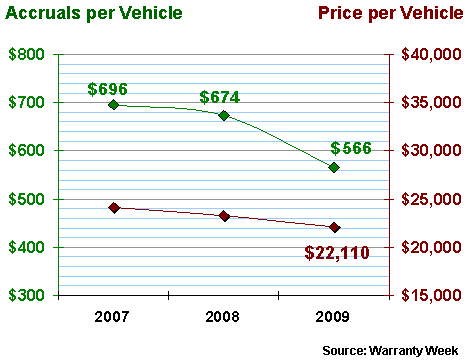
In North America last year, GM sold 2.485 million units and reported $54.944 billion in product revenue. Some quick division gives us a $22,110 figure for revenue per vehicle. Applying that 2.56% accrual rate to the per-unit revenue figure gives us a $566 total for accruals per unit. Both of those numbers are included in Figure 2.
Figure 2
General Motors North America
Average Unit Price &
Warranty Accruals per Unit, 2007-2009
(in US dollars)
Figure 2 also tracks the accruals per unit for 2007 and 2008. The per-unit revenue figure for 2007 is $24,142 and for 2008 it is $23,265. If our math is correct, the accrual rate for both years should be close to 2.9%, as it was across the entire company during those two years.
In other words, for every $1,000 in revenue earned during 2007 and 2008, GM set aside around $29 in warranty accruals, to finance claims it would begin paying as soon as customers began bringing their vehicles back to dealerships for warranty work. And then in 2009, it began setting aside only $25.60 per $1,000 -- its lowest accrual rate ever.
Everything in Figure 2 looks reasonable. So far, so good. The per-unit price remained above $20,000, and the per-unit accrual rate remained above $500.
We're not going to publish the GM Europe chart, but the 2009 figures for that business unit are $365 per vehicle for accruals and $14,253 per vehicle for revenue, based on 1.667 million units sold, $23.759 billion in revenue, and the 2.56% accrual rate. The figures are still reasonable, but they're beginning to test the boundaries of reasonability.
GM International Operations
The trouble really begins with the GM International Operations data that's charted in Figure 3. The GMIO unit covers China, South Korea, India, Egypt, Australia, Brazil, Argentina, Venezuela, and Colombia, among others. It was created after the old GM's bankruptcy, so comparable figures before 2007 are not available (GMIO's jurisdiction was spread amongst multiple units in those years).
In 2009, however, China was GM's second-largest national market, after the U.S. That's big news, in and of itself. GM and its partners sold 1.826 million vehicles in China last year, three times as many as in Brazil, five times as many as in Germany, and seven times as many as in Canada. So China is well over half of GMIO.
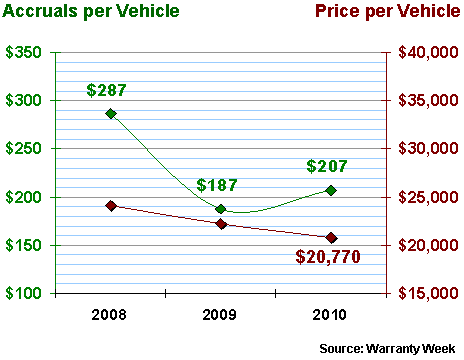
In its annual report, GM announced 2009 sales by GMIO of 3.326 million units, and revenue of $25.413 billion. That works out to only $7,641 per unit. And that unbelievably low figure, we allege, is a function of China. So is the unbelievably low accrual rate per vehicle. In Figure 3 below, we've again used that 2.56% accrual rate to calculate an accrual of only $196 per unit for GMIO.
Figure 3
General Motors International Operations
Average Unit Price &
Warranty Accruals per Unit, 2007-2009
(in US dollars)
We're not going to go near the question of whether $196 per unit seems like an appropriate figure for warranty cost per vehicle. For all we know, it may be twice that, but that would mean the accruals per unit in North America and Europe would be lower than the estimates made here.
However, Figure 3 shows that it's at least mathematically possible for GM to get to this point, if one assumes lower prices and shorter warranties in China. It doesn't make it any more believable, but at least it's possible to create a model where U.S. pricing is above $20,000 yet worldwide accruals are under $357 per unit.
The point is that although we know the accrual rate is not precisely the same for each and every country, it is still possible to make a reasonable warranty cost estimate for each region, as long as the company details both the sales volume and revenue. We could even adjust some of the regional accrual rates up or down, as long as the worldwide total still adds up to the published figure.
Toyota & Honda in China
We ran the same analysis on Toyota and Honda, and while we found lower per-unit prices for cars sold in their Asian markets (defined by both companies as non-Japan Asia) than in either Europe or North America, prices were nowhere near as low as GMIO's level. Then again, Toyota's and Honda's Chinese market shares were nowhere near as high as GM's.
Honda, for instance, showed a per-unit price of $11,780 in Asia, based on ¥1,041 billion in sales and 950,000 units sold in the fiscal year ended March 31, 2010 (and an exchange rate of JP¥93 = US$1.00). That's less than half the average price computed for Honda vehicles in the U.S., Japan or Europe.
Volkswagen published the number of units its joint ventures sell in China (1.397 million units in 2009, up from 989,000 sold in 2008). In fact, were it not for that incredible growth in China, the Volkswagen Group would not have been the only major OEM to show overall unit sales growth last year. All the others, including Toyota, Honda and GM, sold fewer units worldwide in 2009 than they did in 2008.
However, because VW's Chinese operations are joint ventures, VW does not publish the corresponding revenue figures itself. Therefore, for VW at least, we cannot compute an average per-unit revenue figure nor an estimate for per-unit accruals in Asia or China. In that case, the model fails.
Mixing Units?
With Honda, however, the specific question asked by a reader was whether we calculated that the company had the lowest warranty accruals because we were mixing motorcycles and generators up with passenger cars? After all, if a motorcycle or a portable generator is counted as a unit, then any computation of accrual rates per unit is going to be far lower than it would be at a company that sells primarily passenger cars.
Again, to answer this question we have to leave the actual data and get into estimates. And once again, we have to make another assumption that we know not to be true: that warranty costs arise at the same rate across all a given company's product lines.
In other words, if Honda sells that car for $11,780 in China, and if its accrual rate in the most recent fiscal year was just under 1.0%, then it would accrue an average of $117.49 per vehicle sold in China. If it sold a car in the U.S. for $24,972, it would accrue just under 1.0%, or $249.06 in warranty costs, at the time of sale. And, in this model, because warranty costs arise at the same rate across all product lines, Honda would also set aside one percent of the price of a motorcycle or a generator to cover future warranty costs.
Readers should feel free to modify this assumption, but in which direction? For if the goal is to raise the assumed accrual rate for Honda's passenger cars, one must reduce the corresponding accrual rates for its motorcycles and generators. Yet Harley-Davidson has an accrual rate of 1.02% for its motorcycles. And Cummins, while it sells both diesel engines and generators (mostly engines), nevertheless has a 2.5% accrual rate as a company. So it's highly unlikely that Honda's accrual rate for either its motorcycle or generator product lines is significantly below one percent.
Not Enough Revenue Mix?
The other problem is the revenue mix. While 68% of Honda's "units" are either motorcycles or generators, 82% of its product revenue comes from cars. Even if one were to cut the assumed accrual rate for motorcycles and generators in half, the accrual rate for Honda cars would rise to only 1.1%. Cut the estimated accrual rate for motorcycles and generators to 0.2%, and the accrual rate for passenger cars rises to only 1.2%.
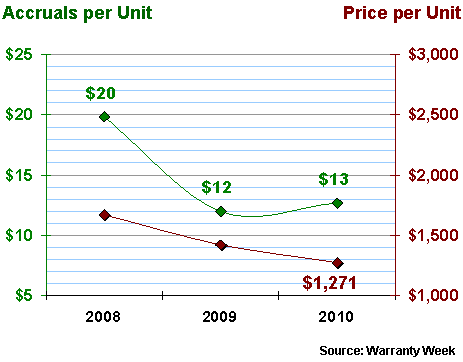
So let's stick with the 1.0% figure for accruals across the whole product line. The company reported ¥79.52 billion in warranty accruals last year. And it sold just under 3.4 million cars for ¥6,555 billion. So the average per-unit price is ¥1,932,429, and the accrual per unit is ¥19,274. Convert to dollars and you get the numbers listed in Figure 4.
Figure 4
Honda Automobiles Worldwide
Average Unit Price &
Warranty Accruals per Unit, 2007-2009
(in US dollars)
As mentioned, the average price for Honda vehicles was higher in Japan, Europe, and North America, but lower in Asia. We'd suggest that accruals per unit followed a proportional pattern, with the accrual rate for passenger cars sticking close to 1.0% of revenue worldwide. But let's get back to the product mix.
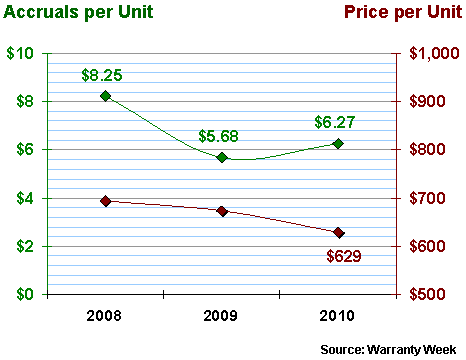
With motorcycles, again, let's keep the 1.0% accrual rate. With sales of 9.639 million units and motorcycle revenue of ¥1,140 billion, the average price is ¥118,290 and the average accrual is ¥11,522. Convert to dollars and you get the numbers listed in Figure 5.
Figure 5
Honda Motorcycles Worldwide
Average Unit Price &
Warranty Accruals per Unit, 2007-2009
(in US dollars)
Repeat the same process for Honda generators. The company sold 4.744 million generators and reported ¥278 billion in generator revenue. The average price is ¥58,516 and the average accrual per unit is ¥590. Convert to dollars and the figures are as follows.
Figure 6
Honda Generators Worldwide
Average Unit Price &
Warranty Accruals per Unit, 2007-2009
(in US dollars)
The point is that although we know the accrual rate is not precisely the same for each and every product, it is still possible to make a reasonable warranty cost estimate for each unit, as long as the company details the sales volume and revenue for each type of product. Fortunately, companies such as Honda and BMW do this where the product mix includes cars and motorcycles, and Daimler and Fiat do this where the mix is cars and trucks.
Therefore, the estimated per-unit figures for warranty accruals are probably not far off from the actual per-unit figures for cars only, or for North America only, or for any other slice that's supported by both unit and revenue figures. Sales in China, or sales of motorcycles, or even sales of motorcycles in China can pull down the averages, but it doesn't make the numbers impossible to believe. What's hard to believe is that somebody could make a car profitably for $7,641 and not go broke paying for the warranty work.
Quality Gains vs. Supplier Recovery
The third question about the figures in the July 8 newsletter asked if the low numbers were the product of a shift in warranty liability from the OEMs to their suppliers. This reader asked if we were mistaking a massive shift of warranty costs from the OEMs to their suppliers for a gain in OEM product quality (and a corresponding decline in repair cost). Instead, he asked, could quality have remained the same but costs were shifted elsewhere?
For instance, let's assume the cost of warranty is always $500 per vehicle. If the OEM pays it all, its cost of warranty is $500 per vehicle. But if the OEM can somehow shift 20% of its warranty costs to its suppliers, then its own cost falls to $400 per vehicle, and the suppliers pay the remaining $100. If it can somehow boost that recovery ratio to 30%, the OEM's share falls to $350 and the suppliers' share rises to $150.
Given that all the manufacturers are reporting net numbers that reflect both payments and reimbursements, it is at least feasible that the decline in accrual rates seen at GM, Ford and others had something to do with an increase in their supplier warranty recovery efforts. But as with the Honda motorcycle question, is there enough money there to move the needle that far?
In 2009, the automotive OEMs tracked by Warranty Week reported $6.38 billion in warranty accruals, while the suppliers reported $1.74 billion in warranty accruals. In 2007, the corresponding figures were $11.47 billion and $1.99 billion, so indeed there has been a noticeable change in the ratio between OEM and supplier warranty costs. Costs fell faster for the OEMs than for the suppliers.
Recovered Costs
Let's reclassify all those supplier warranty accruals as successfully recovered OEM warranty costs. In other words, the $1.74 billion in accruals that suppliers made last year reduced the amount the OEMs would have otherwise had to accrue by $1.74 billion. Had they made everything themselves with no outside suppliers, they would have accrued the full $8.11 billion.
Here's where we diverge from the actual data into estimates: Let's assume that only three-quarters of all OEM warranty costs are recoverable. Let's assume that for one reason or another, one-quarter of each OEM's warranty costs could never be billed back to suppliers. So if the total last year was $8.1 billion for the entire U.S.-based industry, then let's assume that only $6.1 billion could have been recovered from a supplier.
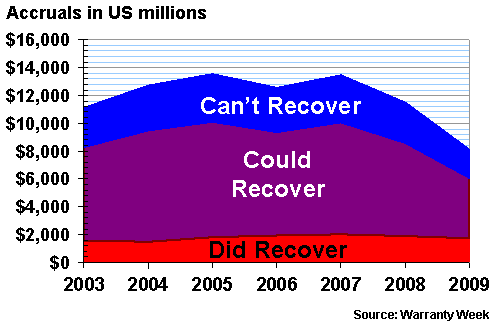
For any given year, we can divide the total warranty outlays into three buckets: warranty costs that actually were recovered from suppliers, warranty costs that could have been recovered but weren't, and warranty costs that OEMs could never have recovered.
In Figure 7, the red is "recovered," the blue is "can't be recovered," and the purple is "could have been recovered." For 2009, the figures are $1.737 billion recovered, $2.034 can't recover, and $4.343 billion that could have been recovered but wasn't.
Figure 7
U.S. Automotive Industry
Supplier Recovery Efforts, 2003-2009
(annual accruals in US $ millions)
It's a little hard to see the year-to-year changes, but the accruals reported by suppliers have remained about the same for the past five years while the accruals reported by OEMs have fallen rather quickly. And while the size of the purple slice is estimated, the size of the red slice is based on actual data.
Size of the Shift?
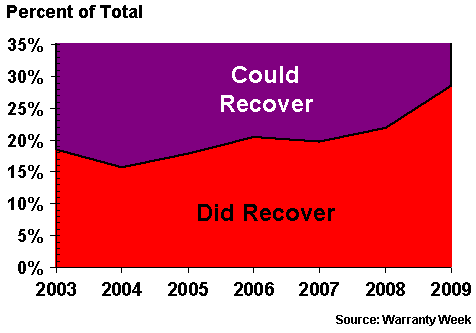
In other words, Figure 7 proves that it is possible for the OEMs to shift some warranty costs to suppliers while cutting their own accruals dramatically. How much has been shifted? For that, we'll have to create a close-up of the red slice, and change the left-hand scale from dollars to percentages of the whole.
In the close-up of Figure 8, we're showing that by our estimates, the OEMs actually did recover 29% of the warranty costs that they could have recovered from their suppliers last year. And that was a big jump from the 22% rate seen in 2008 or the 20% rate in 2007. Back in 2004, the recovery rate was as low as 16% of potential, according to these estimates.
Figure 8
U.S. Automotive Industry
Supplier Recovery Efforts, 2003-2009
(% of annual total recovered from suppliers)
Therefore, it is possible that some accruals formerly made by the OEMs have been shifted to the suppliers in the past few years. So it is possible that a portion of the falling accrual rates have something to do with rising reimbursements by suppliers.
How much is hard to say. But if the supplier recovery rate in 2009 was the same as it was in 2007, suppliers would have accrued $533 million less last year than they actually did. In other words, if the recovery rate was still 20%, suppliers would have accrued $1.2 billion last year instead of $1.74 billion.
So what we're saying is that the increased effort by OEMs to get their suppliers to pay a greater share of total warranty costs probably shifted on the order of half a billion dollars from OEMs to suppliers in 2009. How much does that equal per vehicle?
Supplier Recovery Per Vehicle
Let's omit all the truck and bus manufacturers, and let's overlook all the non-U.S. suppliers that are such a big part of the U.S. market. And let's assume that the $533 million in spoils were split 60/40 by only GM and Ford.
To get there, we'll omit Chrysler as well as Toyota, Honda, Nissan, Hyundai, and all the other OEMs with a significant presence in the U.S. market. And we'll overlook Magna International, Autoliv, Robert Bosch, Denso, Continental, and numerous other international suppliers that have a significant share of the U.S. market.
In other words, we're purposefully overlooking numerous real world factors in order to deliver the maximum benefit from these supplier recovery efforts to just GM and Ford. By our admittedly warped calculations, GM's $320 million net benefit would have reduced its accrual dollars by 11% and accruals per vehicle by $43. And Ford's $213 million net benefit would have reduced accrual dollars by 12% and accruals per vehicle by $44.
The problem is, GM's accruals declined by a massive $155 per vehicle in only one year. And even with our most optimistic supplier recovery assumptions, we can't even attribute a third of GM's reduction in accruals per vehicle to that factor. Surely there must have been some quality gains too? And perhaps the soaring Chinese sales are also moving the averages?
50/50 Warranty Share Programs
GM, Ford and Chrysler have each recently launched warranty cost sharing programs aimed at their suppliers. Not much has been publicly written about them beyond short overviews such as this one published on the Foley & Lardner web site, but what they seem to codify is what the 2009 statistics already show: that suppliers are paying more and OEMs are paying less.
Back in 2004, OEMs made 88% of the total accruals while suppliers paid 12% of the total. In 2009, OEMs had dropped to 79% while suppliers had grown to 21%. The shift in claims paid wasn't as drastic: 88% in 2004 falling to 83% last year. But claims always lag behind accruals, especially with trends such as this.
Another reader had a different explanation: "financial engineering," he called it. He suspected it's one of the perks of government ownership: freedom to use what we'll call government accounting principles. Everything adds up to what you want it to be. Nothing needs to be paid for with actual money. Pay as you go becomes pay what you wish.
The problem with that approach is it's unsustainable. Last year GM paid out $4.083 billion in claims and made only $2.667 billion in accruals. In 2008 it paid out $5.068 in claims and accrued only $4.277 billion. Deficits that big can't be sustained forever. Or can they?
| 


