Commercial Service Contracts, Part 1:The importance of extended warranties sold to commercial customers is steadily increasing, as measured by the percentage of revenue they represent for manufacturers, and by the amount of business they represent for insurance companies. And in response, industry leaders have launched a new trade association for commercial service contracts.
While most U.S. states have carefully constructed laws governing the sale and administration of service contracts and extended warranties aimed at consumers, there is little said about service contracts sold by one business to another business.
For manufacturers, commercial service contracts are growing in importance, as measured by the growing percentage of revenue they represent. But while the providers of consumer service contracts enjoy a set of laws that mostly exempt them from most insurance regulations, providers of commercial service contracts do not.
In response to the growing importance of commercial service contracts, and to the lack of attention upon them by trade associations focused on consumer service contracts, industry leaders have decided to launch the National Commercial Service Contract Association (NCSCA) as a nonprofit Section 501(c)(6) organization dedicated to issue advocacy.

Greg E. Mitchell, an attorney, member, and head of the Insurance Regulatory Practice Group at the law firm of Frost Brown Todd LLC, said the association is designed to provide a forum for those who are interested in the commercial use of extended warranties and service contracts and who would like to help refine the regulatory issues with them.
"We think it's time this year to try to do [on the commercial side] what was done in the past for the consumer side," Mitchell said. "We intend to hold a kick-off informational meeting on January 12 at 10am. The announcement will be going out early next week. We have not opened up membership yet, but we've been talking with a number of companies that are interested in joining."
Mitchell said the January 12 meeting will take place in Indianapolis, on the sidelines of an event called "FBT Insurance Connect," and will also be made available as a webinar online. Interested parties should contact him at +1 (859) 244-7513 or at gmitchell@fbtlaw.com by email if they wish to attend in person or online.
He said that one of the most important action items for that meeting is to have prospective members establish some kind of list of priorities for the association, such as whether it should launch training and certification services, focus on modifications of state insurance laws, and/or run best practices discussions and industry conferences.
"We anticipate it will be an avenue to have collaborative dialog, to be principally involved in advocating changes that are needed in the regulatory landscape, and looking at the conformity, consistency and uniformity of state insurance laws for commercial service contracts on a national basis," Mitchell added.
Growing Importance
With this news, and with the launch in the newsletter last week of a quarterly column about commercial service contracts authored by Jimmy Bynum of Alexander & Preston LLC, it appears the time is right to began tracking the size of the business-to-business portion of the extended warranty industry. Some say it's even bigger than the consumer portion, but nobody has yet ventured a guess.
Warranty Week isn't ready to do so either, but we're getting into position. First we want to take a look at the extended warranty and product repair and maintenance contracts sold by manufacturers to their business customers. Then we'll take a look at the programs run by insurance companies and third-party administrators for the benefit of fleet managers and other business customers.
We are beginning that process this week by taking a look at the annual reports of some of the top manufacturers of trucks, construction equipment, and other heavy industrial products, to see what kind of disclosures they make about the size of their extended warranty programs. Sadly, the general answer was not much.
Before we get into the findings, we have to explain what we found. Accounting rules require companies that sell extended warranties and retain the risk (in other words, retaining a duty to perform and not simply taking a sales commission and passing on the proceeds to an outside administrator and/or an insurance company) to defer recognition of the revenue. They can then recognize the deferred revenue gradually over the life of the service contract, usually on a "straight line" basis.
Most companies that sell multi-year extended warranties recognize a fixed portion of the revenue quarterly. For instance, if a company sells a four-year extended warranty for $400, they would initially defer recognition of all the revenue, and would then recognize it at a rate of $25 per quarter. After a year elapses, they would have recognized $100, and would still have $300 deferred. After 2-1/2 years elapse, they would have recognized $250 and would still have $150 deferred. After three years, they would have recognized $300, and after four years they would have recognized the full amount, as the contract expired.
Sample Table
Meanwhile, they would continue selling extended warranties to other customers with different start and end dates, and would be deferring and recognizing the revenue from those as well. They would do so in a separate account, which would mirror the structure of their product warranty reserve fund. And a table could be constructed to detail the cash flow, in that there would be a beginning balance, additions, subtractions, adjustments, and a closing balance.
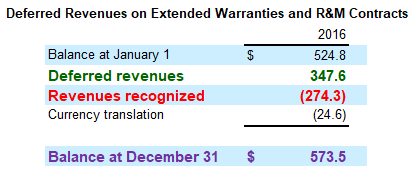
Those five components are included in the table below, which is actually a real-world example taken from the 2016 annual report of Paccar Inc. (Note H, Page 58). The company actually placed its extended warranty table directly after the product warranty table in that annual report, so that investors can see them together as "Product Support Liabilities."
Table 1
Commercial Service Contracts
Deferred Revenue Table Format
2016 Annual Report of Paccar Inc.
We've modified the table so that three of the line items are in colored text. These correlate to the items we will be comparing to product revenue, calculating percentage rates for each. Basically, the colors of the text in Table 1 corresponds to the colors of the lines in the charts of Figures 2 through 4.
Need for Standard Terminology
The problem is, different companies use different labels and terminologies for each of these line item. We will use these: The item called "Deferred revenues" (in green) represents the revenue amassed from recent sales of new service contracts and extended warranties and newly added into the deferred revenue account, so we will call that "New Contract Sales." With straight insurance, this would be called the "gross written premium," all of which would have to be deferred until it is earned over the life of the contract. But of course this isn't insurance, so we'll just call it New Contract Sales.
In Table 1, this would correspond to the $347.6 million in deferred revenue. In our more simplistic example, this would be the line item for the initial $400 sale of an extended warranty. And in either case, since it's always a new addition, it will always be entered into the table as a positive amount.
The amount of $274.3 million called "Revenues recognized" (in red) is variously described by other companies as "amortization of deferred revenue," or as "amortization of premiums received." But in the mainstream insurance business, it would be called the "Earned Premium," representing the portion of the gross written premium that has been recognized as revenue, usually based upon the amount of time gone by (the straight line method). In our example, this would be the $100 recognized per year, or the $25 recognized per quarter.
It would be wrong to compare it to a claims payment, but it would function the same way in terms of its effect on the balance in the account. Therefore, since it's an amount being removed from the deferred revenue account and added into the regular revenue account, it would always be expressed as a negative number. However, it's not an expense, like a claims payment. In fact, we really have no clue about the size of any given company's extended warranty expenses.
The ending balance at December 31 (in purple) will be referred to as "Deferred Revenue," but we could also call it the closing balance or the balance as of some year-ending date. Either way, it represents the remaining amount of unearned premium, or the yet-to-be-recognized portion of the service contract revenue. Basically, it's the net amount, after adding in new contract sales and subtracting out all the earned premium (and after adjusting for acquisitions, foreign exchange fluctuations, etc.), that's left to be recognized in future periods.
The problem is, while most warranty-issuing manufacturers include a detailed table for product warranties in their financial statements, few include a corresponding table for their extended warranties. Some include just the closing balance. Some include just the closing balance and a figure for new contract sales. Some reveal the closing balance and how much of it is classified as a current liability (expected to be paid within a year).
Others, still adhering to the "none of your business" philosophy that prevailed before warranty disclosures became mandatory in 2002, include nothing. In the narrative, they reveal they sell extended warranties, but in the notes to the financial statements they say nothing about how many or how much.
This would seem to be in direct violation of the Financial Accounting Standards Board (FASB) Accounting Standards Codification, specifically ASC 460-10-50-8(b) and ASC 460-10-15-9(b). But just as none of our staff have a degree in accounting, none of us have a badge in law enforcement either.
And when it comes to enforcing product warranty and extended warranty disclosure rules, we are of the opinion that the staff of the U.S. Securities and Exchange Commission has been asleep at the switch for most of the past 15 years. So enjoy your non-compliance with Generally Accepted Accounting Principles. We're making a list and checking it twice. And someday, the SEC will awaken from its slumber and future President Kanye West will drop toys down your chimneys.
Filling In the Blanks
Fortunately, there are various tricks we can use to help us complete the tables so we can measure extended warranty sales in all three ways. If a company includes just the balance, well, there's not much that can be done. But if they include figures for the ending balance and the earned premium, then we can infer that the ending balance from the previous year is the beginning balance this year. Then we have a little algebra problem to solve for X, the amount of new contract sales.
Other companies conveniently separate the ending balance into current and long-term portions. This would get us kicked out of accounting school, but to us the amount of current deferred revenue at the end of last year would be the same as the amount of premium we will have to recognize, amortize, and earn this year. So they're helping us fill in the blank for next year when they tell us what's current now.
Using these tricks and other sleights of hand, we have been able to cobble together nearly complete tables for the extended warranty operations of nine industrial product manufacturers: Brunswick Corp.; Carlisle Companies Inc.; Cummins Inc.; Deere & Company; Ingersoll-Rand plc; Navistar International Corp.; Oshkosh Corp.; Paccar Inc.; and Polaris Industries Inc. In addition, we put together a series of beginning and closing balances for United Technologies Corp.
We went back into the annual reports of each company for the past ten years, and in general, what we found was that the detail of disclosures has been increasing year by year. For instance, Paccar has included a full table for the past four years, but included no extended warranty data for the previous six years. Brunswick has included a full table for the past two years, but in previous years all it revealed was the closing balance.
In Figure 2, what we've done is to figure out an average for just the data points we found or can derive mathematically. And so for instance, in 2007 we found data for five closing balances, four earned premium, and two new contract sales. And we were able to derive two additional figures for new contract sales, based on the beginning and ending balances and the amount of premium earned. In 2012, we has seven closing balances, and five pair of earned premiums and new contract sales figures. In 2016 we had nine complete sets and one closing balance.
What figure 2 shows clearly is that the proportion of these companies' revenue attributable to extended warranties has been steadily increasing over the past decade. Back in 2007, their deferred revenue was equal to only 1.5% of their total revenue. By 2012 it was up to 3.1%, and by 2016 it was up to 3.9%.
Figure 2
Commercial Service Contracts
Sales as a Percentage of Product Revenue
Industrial Manufacturer Average
(in percent, 2007-2016)
There were gradual increases as well with the other metrics. Earned premium was only 0.4% of revenue in 2007. By 2012 it was up to 0.6%, and by 2016 it was up to 1.0%. New contract sales were equal to 0.6% of revenue in 2007. They climbed to 0.9% by 2012 and to 1.1% by 2016.
This chart clearly shows that the importance of extended warranties is increasing within this group of manufacturers. And although Brunswick, Polaris, and Carlisle may be selling to consumers as well as commercial customers, the rest are dominated by commercial sales. So whether it be trucks or tools, jet engines or farm equipment, at least within this small sample the importance of extended warranties is rising.
Additional Examples?
So far, we've found nine top industrial manufacturers that currently reveal details about the size of their extended warranty programs, and we will continue to track these and other companies going forward. But we need your help. Please contact the editor if you know of any manufacturers that reveal any extended warranty metrics in their financial statements.
Ten years ago, however, only Cummins and Deere included all three key metrics in their annual reports: new contract sales, earned premium, and deferred revenue closing balance. So these are the only two companies for which we can construct a ten-year trend line that's free of accounting tricks or guesstimates. So what follows are taken straight from the books of these companies.
For Cummins, 2010 and 2011 were down years, in that the percentage of revenue attributable to extended warranties fell for all three of our metrics. The amount of new contract sales also dipped as a percentage of revenue in 2013 and 2016. But the amount of earned premium and the amount left as deferred revenue at the end of each year continued to increase in every year since 2011.
Figure 3
Cummins Commercial Service Contract Sales
As a Percentage of Product Revenue
(in percent, 2007-2016)
Statistics can be misleading or misinterpreted. But what one can say from the data above is that at Cummins, the percentage of sales attributable to extended warranties tripled from 2007 to 2015, from 0.5% of revenue to 1.5% of revenue. By 2016, the amount of deferred revenue carried on the books from sales of extended warranties had more than quadrupled, from $166 million on January 1, 2006 to $745 million on December 31, 2016. The amount of earned premium from extended warranty sales rose from 0.4% of revenue in 2007 to 1.1% in 2016.
So there's no denying that the importance of extended warranty sales is rising at Cummins, and by extension, within the truck and heavy equipment industry. Even without any explanation of what the data means or where it's taken from, the trend line is clearly upwards in Figure 3.
But Are They Profitable?
We should note that this information gives us absolutely no insight into the answer to a very important question: are these extended warranty programs profitable? An insurance company would have to reveal this in the form of a loss ratio, in which anything below 100% represents a net profit, and any ratios above 100% represent an unprofitable program. But these are not insurance companies, and these are not insurance policies. And so we have absolutely no idea about the amount of repair expenses these extended warranties generate, nor whether those expenses exceed premiums. That information remains "none of your business," and is not generally part of the required disclosures.
Finally, let's take a look at the extended warranty metrics of John Deere. In Figure 4, we see a similar pattern, though it's more of a swoon than a decline, with new sales falling until 2010, the ending balance falling until 2011, and the earned premium falling until 2012. But they've been rising since, with the exception of yet another swoon in new sales from 2015 to 2016.
Figure 4
Deere Commercial Service Contract Sales
As a Percentage of Product Revenue
(in percent, 2007-2016)
Once again, statistics can be misleading, but one could say the importance of extended warranties has been rising at Deere, based on the amount of deferred revenue from program sales nearly doubling from about one percent in 2007 to 1.9% in 2016. And the amount of earned premium from extended warranties did actually double and then some, from 0.4% in 2007 to nearly 0.9% in 2016.
Therefore, although it's a bit of an oversimplification of a complex trend with lots of moving parts, it would be truthful to say that the importance of extended warranties to industrial manufacturers has doubled in the past decade. Based on how much they sell, how much they defer, or how much revenue they recognize, all the metrics are up from 2007 to 2016, although there have been dips along the way.
| 


