Warranty Claims Rates:
In both the automotive and computer industries, the OEM -- the brand name on the product -- is frequently left holding the bag when it comes time to pay warranty claims. As the latest data shows, their suppliers usually see much lower warranty claims rates.
Warranty is a process that begins with a manufacturer and ends with a customer. In the complex warranty chain, however, the customer may itself be a manufacturer who incorporates another company's parts and systems into its own products, assembling and reselling the finished product.
In the automotive industry, the Original Equipment Manufacturer is the nameplate on the vehicle, be it Ford, Caterpillar, or Harley Davidson. But each OEM frequently sources its tires, transmissions, seat covers, and other components from the likes of Cummins, Delphi, Goodyear, or ArvinMeritor. It's much the same in the computer industry, where Hewlett-Packard, IBM, Sun Microsystems, or Apple is the name on the box but the circuit boards and disk drives inside are made elsewhere. Sometimes the suppliers have their own parts and components suppliers, in a chain that ultimately stretches back to suppliers of raw materials such as steel, silicon, and plastic.
Brand Identity?
The end user buys a Buick or a Dell, and when warranty service is required, Buick or Dell get the call. The customer doesn't care who made the steering wheel or the disk drive. They just want it fixed. It's up to the OEM to decide if and how to recover some of that warranty cost from their suppliers.
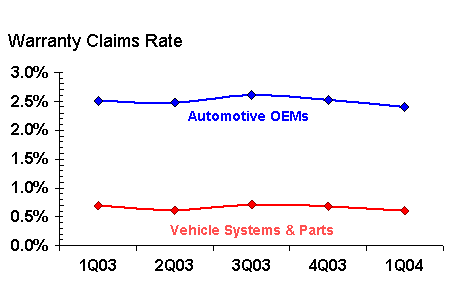
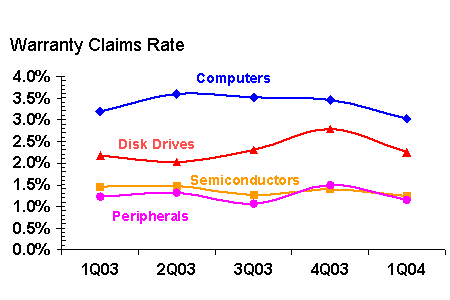
It appears that in both the automotive and computer industries, it is the OEM that more times than not is the one left holding the bag. While the final assemblers of everything from on-highway trucks to scooters average warranty claims rates around 2.5% of product revenue, their suppliers average only 0.7%. While the major American computer brands see claims rates in the range of 3.0% to 3.5%, the makers of semiconductors and circuit boards more typically see rates below 1.5%.
In the past month, Warranty Week has collected detailed warranty claims and accruals data from roughly 600 manufacturers, plus partial reports from another 75 companies. We're still waiting for 75 more U.S.-based manufacturers to file their latest quarterly 10-Q or annual 10-K statements with the U.S. Securities and Exchange Commission. Around 30 are overdue, while 44 are scheduled for mid-June or early July filings.
Even with just the 600 collected so far, this trend is clear. OEMs experience higher warranty claims rates than their suppliers, either because they won't or can't pass on the costs to those suppliers. Sometimes it's simply a matter of no clear cause and effect, especially in the case of complex assemblies. Other times, the components were provided "as is" for a lower price. It's the rare case where a manufacturing defect is so plain and so frequent that an OEM can trace the cause back to one supplier, one factory, or one shipment.
OEMs vs. Suppliers
Let's take a look at the automotive industry. The comparison can best be made between the Ford Motor Co. and its spin-off Visteon Corp., or perhaps between General Motors and Delphi. Ford and GM, respectively, saw warranty claims rates of 2.2% and 2.8% during the first quarter of 2004. Visteon turned in a 0.2% rate, while Delphi is around 0.4%. In no way are we implying that Visteon and Delphi are to blame for Ford's and GM's warranty costs. We're just noting that their customers -- the OEMs -- experience claims rates ten times higher than they do.
But Ford and GM are not the only OEMs in the wider automotive business. There also are the makers of trucks, motorcycles, buses, recreational vehicles, construction equipment, scooters, fire trucks, and ambulances. Warranty Week tracks around 40 automotive OEMs in all. While Ford and GM are by far the biggest, most of the OEMs saw claims rates in a range of 2% to 3%. Caterpillar was a bit below 2%, while Fleetwood Enterprises was a bit above 3%. In the trucking industry, where a vehicle is really a collection of separate warranties for the major components, claims rates were a bit lower than they were for OEMs making passenger cars, but not by much. Claims rates for recreational vehicles also were a bit lower than for cars, but again, by only a few tenths of a point.
Meanwhile, in the parts and components end of the automotive industry, only a select few see claims rates much above 2%. Engine makers such as Cummins and aftermarket parts makers such as Standard Motor Products Inc. seem to be the types of automotive manufacturers that skew towards the high end of the scale. More typical are the 0.4% rates of Dana Corp. or the 0.2% rate of Johnson Controls Inc. Tires, despite all the publicity surrounding the Firestone recall, also are firmly entrenched at the low end of the scale. Goodyear saw an 0.1% claims rate for 2003, while Cooper Tire & Rubber saw an 0.3% claims rate in the first quarter of 2004 -- a slim increase from 2003.
In the following chart, the average claims rates of 40 automotive OEMs are plotted alongside those of 75 of their suppliers. As is clear from the gap between the red and the blue lines, their warranty experiences during the past 15 months have been very different. More importantly, the flatness of the lines means that the situation is not really changing all that much.
Automotive Industry
OEMs vs. Suppliers
Warranty Claims Rates,
First Quarter 2003 to First Quarter 2004

Source: Warranty Week from SEC data
It's relatively easy to spot the trend in terms of who, what, where, and when. It's more difficult to come up with reasons for the how and why. But there's no denying that a wide gap exists between the claims rates seen by the makers of the vehicles and the suppliers of their parts and components.
It's much the same story in the computer industry, where the top 14 manufacturers of servers, personal computers, laptops, notebooks, and handhelds face the consumer and absorb the bulk of the warranty costs. The makers of data storage systems see a somewhat lower claims rate, while the makers of printed circuits and semiconductors see an even lower rate.
Printer Business Model
The exception seems to be printers, but this is likely due to their business model. In the chart below, printers are lumped in with all other peripherals, which see a typical claims rate in the 1.0% to 1.5% range. Printers on their own experience claims rates of 8% to 10%, because the price of the basic hardware is so heavily discounted. The revenue (and profits) derived from sales of toner and other printer supplies is not counted, because consumables are not usually backed with a warranty. They are guaranteed to work, but they're designed to be consumed and replaced.
Within the peripherals category in this chart, the high claims rates of printers is masked by the low claims rates of everything from monitors and speakers to batteries and scanners. So while Lexmark is at 8.7%, Tektronix is at 1.2%. While the digital projectors of inFocus Corp. are at 3.5%, the office machines of Xerox Corp. are at 1.8%. Meanwhile, the weighted average of some 63 peripherals manufacturers was at 1.15% during the first quarter.
Computer Industry
OEMs vs. Suppliers
Warranty Claims Rates,
First Quarter 2003 to First Quarter 2004

Source: Warranty Week from SEC data
By the way, all of the manufacturers of electronics components and printed circuit boards are counted within the sector entitled "semiconductors." All of the makers of flash memory, tape drives, and optical storage systems are counted under the "disk drive" heading. The choice of shorter labels for the red and orange lines was strictly an effort to avoid clutter.
As with automotive, however, the trend is clear. Those who put their name on the box experience higher warranty claims rates than those who supply the OEMs. While the curves aren't as flat in the computer market as they are in the automotive market, their relative positions are the same. The blue line -- the OEM's line -- is always higher than its suppliers.
High Claims Processing Costs?
Perhaps part of the reason is the cost of claims processing? Perhaps it's more expensive to process the claims of millions of consumers through thousands of dealers than it is to process the business-to-business claims coming in from just one or two OEMs? There must be a reason for the gap that has nothing to do with manufacturing, because if it was simply a matter of better quality control on the factory floor, why would the breakthroughs be restricted to just the supplier category? Why do almost all the suppliers have lower claims rates than almost all the OEMs?
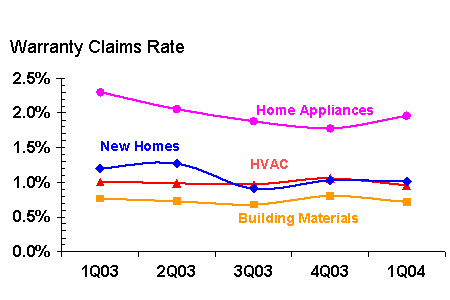
Interestingly, this trend does not seem to cross over into every industry. The most notable exception seems to be the housing market, where a primary contractor manages the supply of subcontractor labor, purchased building materials, and appliances such as ovens, refrigerators, heating units and central air conditioning. In the chart below, the blue line is again the "OEM," though that term does not really fit the situation of a primary contractor overseeing the construction of new homes.
New Home Industry
Builders vs. Suppliers
Warranty Claims Rates,
First Quarter 2003 to First Quarter 2004

Source: Warranty Week from SEC data
Major homebuilders such as Lennar Corp., Pulte Homes Inc., KB Home, Centex Corp., and D.R. Horton Inc. see warranty claims rates generally in the 0.5% to 1.5% range, with a weighted average of 1.2% for the group in the first quarter of 2003 and 1.0% in the first quarter of 2004.
Perhaps home builders are better at supplier recovery than either automakers or computer manufacturers? Or perhaps proportionally low warranty claims rates are characteristic of the homebuilding industry? Maybe it's a function of home prices being many multiples larger than the average cost of a claim? In other words, a $50 claim on a computer is 3% of its price. A $500 claim on a car is 2.5% of its price. But a $2,000 claim on a home is only 1% of its price.
Or maybe it's a function of the product's relative simplicity? If there's water in the basement, it's probably not an electrical problem. If there's no heat, it's probably not caused by cracks in the foundation. It doesn't take a mechanical engineering degree to diagnose the cause of a home's problem and pin it on a specific system vendor or subcontractor. With a computer or an automobile, however, one part's failure can cause others to fail. A bad power supply could burn out a motherboard. Both need to be replaced, but the blame can't be pinned on the motherboard's manufacturer. It might even be difficult to pin the blame on the power supply vendor. And even if it were possible, they might be liable only for a replacement power supply, and not either the motherboard or the labor involved.
In previous issues of Warranty Week, we've detailed the relatively low claims rates seen by most manufacturers of heating, ventilation, and air conditioning systems, which is confirmed by the red line in the chart above. What hasn't been previously shown are the similarly low rates seen by the makers of building supplies. This includes everything from plumbing hardware and hot tubs to carpets and countertops. It includes the windows of Owens Corning (0.3% claims rate) and the kitchen cabinets of the Masco Corp. (also a 0.3% claims rate). And it includes the pumps, pools, and tubs of Pentair Inc. (1.4%) and Jacuzzi Brands Inc. (1.1%).
Household Names
The highest claims rates to be found in the home are from kitchen and cleaning appliances. Setting aside for a moment those manufacturers who cross over into HVAC (American Standard Companies Inc.) or automotive (NACCO Industries Inc.), this segment is dominated by the likes of Whirlpool Corp., Maytag Corp., Applica Inc., Helen of Troy Ltd., Fedders Corp., Middleby Corp., Water Pik Technologies, and National Presto Industries Inc. Most are in the same 2% to 3% range as the automakers, with Water Pik's 4.2% and Fedders' 1.7% serving as the extremes.
With both automakers and computer manufacturers, it is apparent that the consumer-facing brands absorb most of the warranty expense. Perhaps the reason the same trend isn't so clearly defined in the new home industry also is a function of branding. Think about it. Who has the more visible brand image: Pulte and Lennar, or Maytag and Whirlpool? Perhaps readers can suggest some additional reasons why the final assemblers in autos and computers are left holding the bag in terms of warranty costs while homebuilders seem more adept at passing it on.


