
of APQC is the latest in a series of contributed editorial columns. Readers
who are interested in authoring future contributed columns can click here
to see the Guidelines for Editorial Submissions page.
Service After Sales:
Getting the biggest bang for your buck in
after-sales solutions through benchmarking.
By Deb Unzicker and Cheryl Harrity of APQC.
Organizations have learned that it is far less costly to retain current customers than it is to find new ones. The question is how to do it. While there isn't a secret formula, high performing companies have found that investing in their service after sales function is a big step in the right direction. In addition to customer loyalty, service after sales has also been shown to be essential in boosting revenue. Studies in this area show that on average, the service after sales area contributes 24% of a firm's revenue, but as much as 45% of its gross profits.
Service after sales has become an integral part of the best-practice organization's overall offering when it comes to building loyalty, improving customer satisfaction, reducing costs, improving product design and discovering new market opportunities. In addition, as mentioned above, it is also profitable. Spare parts and after-sales services are estimated to account for approximately 8% of the United States' annual GDP.
Service after sales encompasses a variety of actions, from the development of strategies and managing customer calls to service delivery and the liquidation of refurbished items. Such aftermarket needs necessitate a global focus on the entire customer/supplier experience. They also require easily repeatable processes.
The Service After Sales Operation
This article will take a close look at a variety of factors that go into considering a service after sales operation:
- What performance measures are key in tracking service after sales effectively?
- Examining cost effectiveness;
- Examining process efficiency; and
- Examining cycle time.
- Why do the measures matter?
- Improving response times.
- Using the measures.
- Cisco example; and
- Whirlpool example.
- A chance to benchmark your own service after sales organization
- Participate in a new, no cost survey from APQC's Open Standards Benchmarking Collaborative research and WarrantyWeek
- Visit www.apqc.org/warrantyweeksurvey
"It's good to know that your organization can get these benchmarking answers," said Tom Bellinger, a strategist in IBM Systems and Technology Group Operations. "You may be way off the mark compared to the best in your industry."
Performance Measures
To better understand how to assess your firm's service after sales function through benchmarking, a few key measures should be evaluated.
Benchmarking hinges on specific measures: cost effectiveness, process efficiency, and cycle time. Figure 1 lists the measures used in the current assessment level research by APQC, a 30-year old, non-profit global resource for process and performance improvement through benchmarking and research. The Service After Sales research project is a part of its new Open Standards Benchmarking Collaborative (OSBC) research.
Figure 1
Key Measures for
Service After Sales Benchmarking
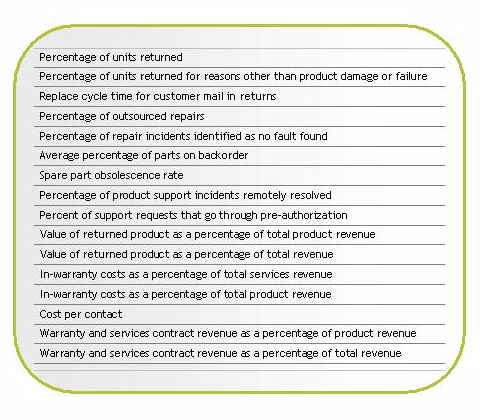
Source: APQC
Keeping service after sales cost-effective presents a challenge to many organizations, said Bellinger. Two cost measures from the current research that are helpful in assessing the service after sales function are in-warranty costs as a percentage of sales revenue (and/or total revenue) and cost per contact.
"You don't want sales deals that are money losers," Bellinger said. "You have to make a judgment on whether a deal is profitable."
"One of the things you want to do is track how well you're selling your services up front," said Bellinger. The current research will report on the percentage change in services revenue over the past three years.
Meanwhile, process efficiency measures effectively monitor how quickly service after sales activities are carried out. Measures from the current research addressing process efficiency are percentage of support requests resolved remotely and percentage of support requests that go through a pre-authorization process.
Bellinger continues, "Parts management is really critical. Obsolescence occurs so quickly. An estimated 23% of parts become obsolete each year. Avoiding obsolescence depends on a keen eye toward inventory, Bellinger added. The current research measures the percentage of parts on back-order and spare part obsolescence rate.
In addition to obsolescence, the reasons for returns play a big role in service after sales. The more components are vended out, the more an organization expects its suppliers to carry a warranty. Also, because most commodities come with intrinsic failures, Bellinger said, it is especially important to quickly identify problems and track how long it takes to find the failure.
"If you've replaced a part, how do you apply that to your value?" Bellinger asked. "If your products become more complex and your diagnostics aren't also developed, then those [return] numbers will go up."
"We want to know if we've made the right problem determination," he said. Therefore, the current research measures not only the number and value of returns, but also the percentage of units accepted for return for reasons other than product damage or failure and the percentage of repairs where no fault was found.
Last but certainly not least, cycle time measures are valuable tools for process assessment. In both the depot repair and end-user exchange environments, a certain level of expectation exists for average turnaround time performance. Oftentimes, an organization will announce service level response times to its customers, such as one day, one week, and so on. The current research will report on the replacement cycle time for customer mail-in returns.
Overall, added Bellinger, the objective is to get the asset returned as quickly as possible.
"The more timely you can be, the better off you are," he said.
Why the Measures Matter
Service after sales has accounted for a large portion of organizations' profits in recent years. A 1999 report published by AMR Research (see Figure 2) indicated that businesses earn 45% of their gross profits in the aftermarket, while it accounts for 24% of revenues.
Figure 2
Aftermarket Earnings, 1999
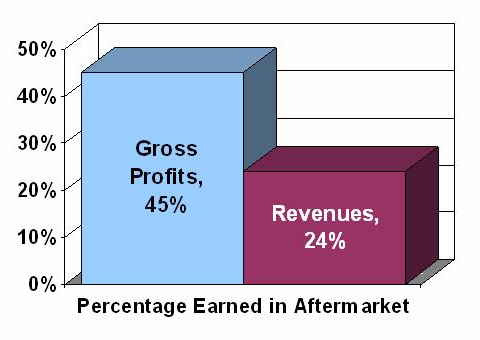
Source: APQC
The measures do more than simply provide a snapshot of an organization's service after sales operation. They provide valuable insight into where a company can develop service after sales. Important components like customer interaction, product return management, product service performance, service repair parts management, value-added service offerings, and product refurbishment could all stand improvement once benchmarks are introduced into the equation.
Response times over the years are a good indicator of how service after sales has evolved. For instance, while semiconductor manufacturers might have expected two-day response times from their suppliers in the 1980s, today they expect responses to help requests in less than 15 minutes. The quality of after-sales service in many instances has proved to have a direct correlation with customers' decisions to purchase again. Consequently, automakers such as Lexus and Saturn have beat out the likes of Ford and Chrysler when it comes to repeat purchases.
No two organizations handle service after sales in exactly the same way. At IBM's Systems and Technology Group, most service after sales efforts are handled in house. An automotive manufacturer, however, conducts its after-sales services primarily through its dealerships.
"Depending on the company's business model, some of these questions may be more important or key," Bellinger said. "Perhaps a company is focused on services and not product profits, or many of the warranty chain activities are outsourced."
Using the Measures
Bridging the gap from understanding after-sales measures and implementation can be a lofty challenge for any organization. Some interpret service after sales as a problematic means to a more important end, not to mention an unnecessary expense. Service after sales at one time was extremely difficult to manage -- production and sales functions were treated as lowly divisions.
The automotive industry offers telling examples of how service after sales once bore the ire of its managers. When the Harvard Business Review studied the service after sales network of a major automotive manufacturer a few years ago, it discovered that its spare parts warehouses and dealers had little to no coordination. About half of its customers faced problems like unnecessary delays with vehicle repairs due to dealerships lacking the correct spare parts.
Even if an organization funnels a significant portion of its working capital into service after sales, it can still face challenges. Network equipment manufacturer Cisco Systems offers such services as hardware and software support for the hundreds of products it builds. Cisco's warranty program requires the company to offer spare parts and service contracts as needed.
Cisco utilizes field engineers from Dimension Data, Hewlett-Packard Co., and IBM Corp., while it uses Choice Logistics Inc., DHL International, FedEx Corp. and other partners for logistics. Meanwhile, its repair services are handled through Celestica Inc., Foxconn Electronics Inc., and Jabil Circuit Inc., to name a few. The infrastructure encompasses 800 fulfillment centers, seven country distribution centers, 18 repair centers, and five materials return-processing centers.
Previously, Cisco managed service after sales with easily implementable heuristics. It met nearby high-priority customer demands while warehouses took care of requests from other customers. Cisco failed to coordinate stocking policy between its forward and central locations, causing the network to become less flexible and subject to rising inventory levels.
As a result, Cisco executives implemented a new spare-parts inventory system by using demand histories to create probability-based forecasts of parts requirements. It began calculating resource allocation options on a daily basis and accounted for interactions between its forward and central stocking locations. That resulted in faster resource deployment, lower costs, and better response times.
Whirlpool Corp. faced another service after sales dilemma in finding a claims processing solution. The company previously utilized more than two dozen employees to process claims paperwork, translating into delays and extra costs incurred by its customers. Today, Whirlpool's service after sales program utilizes a service directory that automates partner data updates, thereby enabling service companies to be paid more quickly.
The properly functioning service after sales initiative has given Whirlpool a more global vision of why repairs have been instituted, down to the level of model and serial number. While quality information is filtered to engineers, the service after sales system also tracks how long it takes partners to file claims. The first-time fix measure mentioned above is an important one to Whirlpool -- its service after sales function offers information on specific parts so that partners can make sure their repair trucks have the appropriate parts when they are dispatched.
Collect Your Own Measures
APQC's OSBC assessment project offers a complimentary and powerful tool in benchmarking research. The Service After Sales assessment research project gives organizations valuable insight into how they perform across a variety of performance measures. OSBC research supports improvement and change through the identification of common measures and definitions, access to reliable benchmarks, and access to best practices and high-performance drivers.
The Service After Sales assessment benchmarking study also supplies crucial performance benchmarks and best practices involved in financial, operational, and service-and-support processes that make up aftermarket services. Furthermore, with sufficient enough response, specific industry questions related to aerospace and defense, automotive, electronics, retail, and general industry will help focus the research.
Even though an estimated 80% of a product's costs is incurred upon its design, customer support (i.e. service after sales) commands the longest portion of the product's life. And buyers expect businesses to fix their problems quickly (even if they don't expect perfection). As more executives begin to see that service after sales provides the revenue source with the most longevity (with the smallest required investment), after-sales will become a more important touchstone in the overall supply chain of the best-practice organization.
Visit www.apqc.org/warrantyweeksurvey to learn more about APQC's Service After Sales assessment benchmarking research, download the key measures list, and view the survey online. By participating in this complimentary research, you'll receive a comprehensive report detailing the demographic profiles of participating companies as well as tables and graphs depicting levels of achievement by the study participants on the study measures, all packaged in easy-to-read format. The data charts will feature your the aggregate performance of companies in the high, median and low performance segments.
Resources:
Morris A. Cohen, Narendra Agrawal, and Vipul Agrawal. "Winning in the Aftermarket." Harvard Business Review, May 2006.
Carolyn Dunn. "Beyond the Sale: Getting the Most from Service After Sales." APQC, July 2006.
Reed Business Information. "Stand by your brand." Manufacturing Business Technology, September 2005.