Automotive Warranties:
Thanks to reduced warranty expenses at GM, claims were up only slightly for the auto industry in 2006. With four years of data in hand, it's now possible to calculate typical claims rates by product or vehicle type. And while warranty expenses for some are on a downward trend, others have seen costs rise.
US-based automotive manufacturers spent almost $12.8 billion on warranty claims in 2006, up a slim 1.6% over year-before levels. Of the 153 automotive manufacturers tracked by Warranty Week, 94 paid out more dollars in claims in 2006 than they did in 2005, while 57 paid out less, and two paid out the same amount in both years.
As a percentage of product sales, the results were more evenly split. Of the 153 manufacturers, 78 saw their claims rate rise while 75 saw it fall. Taken together, all 153 manufacturers paid out 1.68% of their product revenue in warranty claims in 2006, up a slim 0.01% from 2005 levels. What this means is that claims grew a bit faster than sales.
OEMs continue to pay the vast majority of the total outlay, but there's been a slight change in the ratio between the OEMs and their suppliers. From 2003 to 2005, the OEMs always paid out around 87% of the total, while their suppliers paid out only 13%. But in 2006, that ratio changed a bit to 86%/14%, because the suppliers' total grew by $130 million while the OEMs grew by only $67 million.
Slowdown in Warranty Cost Increases?
In Figure 1, we've detailed the outlays for the OEMs (in dark blue) and their suppliers (in light blue) for the past four years. Even with eyeballs alone, it's clear there's been something of a slowdown in the rate at which warranty spending increased last year. From 2004 to 2005, total claims grew by 7.9%. From 2003 to 2004, total claims grew by 4.8%.
Figure 1
All US-Based Automotive Manufacturers:
Warranty Claims per Year, 2003 to 2006
(in $ Billions per Year)

As mentioned, sales also grew in the past year, but claims grew a bit faster, causing the overall claims rate to notch up to 1.68% by the end of 2006. But that's the same claims rate measured at the end of 2003, so in reality the claims rate for the industry as a whole has changed little in the past four years. In fact, as detailed by the middle line in Figure 2, the overall industry claims rate has always started out the year low and ended it high -- a pattern broken only in 2003 when the third quarter was a bit higher than the fourth.
As Figure 2 also details, the gap between the claims rate seen by OEMs and their suppliers is now beginning to narrow. At the end of 2006, OEMs paid out 2.44% and suppliers 0.85%, for a gap of 1.59%. A year ago, the gap stood at 1.73% and historically it's been closer to 1.8% or 1.9%. So this may be a sign that supplier recovery efforts are finally beginning to register.
Figure 2
All US-Based Automotive Manufacturers:
Warranty Claims Rates, 2003 to 2006
(As a % of Product Sales)

Let's not get carried away, though. General Motors paid out $233 million less in 2006 than in 2005, and this alone took almost 2% off the top of the industry's increase. GM's claims rate fell from 2.9% to 2.6%, while Ford Motor's grew from 2.6% to 2.9%. But just these two companies comprise more than two-thirds of the whole US-based auto sector, so anything that happens to either one of them is going to have a big impact on the totals.
Readers who can't view these charts because their companies use email filters should go to http://www.warrantyweek.com/newsarchive/ww20070515.html to see the Online Edition of this article.
By the way, the Chrysler Group is not part of these totals because it is technically part of a German company. And even if it is acquired by Cerberus Capital Management, it will still not be part of these totals, because it will be a privately-held company. Neither foreign-based nor privately-held companies are required to report their warranty expenditures to the US Securities and Exchange Commission.
Warranty Claims Rates by Product
The other 151 US-based automotive companies that are reporting their warranty expenditures to the SEC vary tremendously in size. It makes little sense to go into detail how much each pays in claims, because it varies all the way from $8,075 for Puradyn Filter Technologies Inc. to $745 million for Caterpillar Inc.
It makes more sense to look at each company's claims rate -- the percentage of product sales each pays out in claims. Puradyn is at 0.3% of sales while Cat is at 1.9%. In fact, the median is just under 0.7%, while the average is at 1.6%, which goes to show how heavily the latter number is weighted by the large OEMs.
What we've done in Figures 3 and 4 is to group some of these OEMs and suppliers by the type of product they make. There are ten groupings all together, so we fit five onto each chart. Hopefully, that makes it a bit easier to notice some of the patterns.
At the top of Figure 3 is a group with only two members: GM and Ford. At the bottom of Figure 4 are the tire manufacturers, comprised of four large and three small companies. In between are eight other groupings for everything from RVs to drivetrains.
Figure 3
Automotive Manufacturers by Type:
Warranty Claims Rates, 2003 to 2006
(As a % of Product Sales)

Some manufacturers are members of more than one group, depending on their product lines. For instance, we have Caterpillar in the groupings for both farm equipment and drivetrains, because they manufacture both earth-moving equipment and diesel truck engines. Navistar we have in both the truck and bus category as well as in drivetrains, because they most famously are supplying Ford with diesel engines.
However, because Navistar hasn't filed a financial statement with the SEC for more than a year, we don't have any warranty data for them for the past five quarters. That absence can most clearly be seen in the truck category, where the claims rate dove below 1.5% as soon as Navistar dropped out of the average. So we've marked that with a dotted line, to alert readers that the change is not real. It's simply a reflection of the fact that Navistar traditionally reports a higher claims rate than competitors such as Paccar or Oshkosh Truck Corp.
Figure 4
Automotive Manufacturers by Type:
Warranty Claims Rates, 2003 to 2006
(As a % of Product Sales)

Notice in both Figures 3 and 4 that the lines for the most part are stable. Yes, they vary over time, but they do so within a fairly narrow range. RVs and farm equipment seem to follow a seasonal pattern, while buses show a bit of true volatility.
Therefore, except in the case of buses, one could almost say that these lines represent the "natural" rate of warranty for these types of vehicles or parts. If you're making tires, your product type has a "natural" rate of warranty around 0.3% of revenue. So if you sell $100 million worth of tires, you should expect to pay out $300,000 in warranty claims. That doesn't tell you how many tires will fail or how often, but it does give you a clue as to how much should be set aside in accruals. For every $1,000 in tire revenue, you should put aside $3 to fund future warranty claims.
Notice also how the lines for drivetrains and emergency vehicles are virtually on top of each other. We don't want to make too much of this, but isn't it curious that engines, axles and transmissions have the same warranty ratios as fire engines and ambulances? And isn't it also curious that emergency vehicles have the lowest warranty ratios of all the vehicle types -- even motorcycles?
Warranty Claims by Company
While product-by-product averages are useful, we don't want to suggest that one type of product is more reliable than another. We don't know if motorcycles are not more or less reliable than buses. All we can say is that bus manufacturers pay out a higher percentage of their sales revenue in warranty claims. Is it because buses break down more often or is it because buses have more parts? Or perhaps buses cost more to fix? We can't tell from these numbers.
We also don't want to compare one company against another, especially across industries, because we can never be sure that each company is counting the exact same list of cost components in the exact same way. Although in the automotive industry, most of the manufacturers seem to report only their direct costs -- what they pay to others -- and not indirect costs such as publishing manuals or operating call centers.
In the four charts that follow, we're just going to shine a spotlight on the warranty costs of four of the largest OEMs besides GM and Ford. Since each is a leading manufacturer within some of these groupings, what happens to them has a heavy bearing on what happens to the averages in Figures 3 and 4.
Paccar is the second largest truck manufacturer, behind only DaimlerChrysler's own Freightliner nameplate. Its brands include Peterbilt, Kenworth, DAF, and Foden. As can be seen in Figure 5, the company has seem a slow but steady decline in its warranty claims rate, although there's been a slight rise during the second half of 2006.
Figure 5
Paccar Inc.
Warranty Claims & Accruals, 2003 to 2006
(in $m and % of Product Sales)
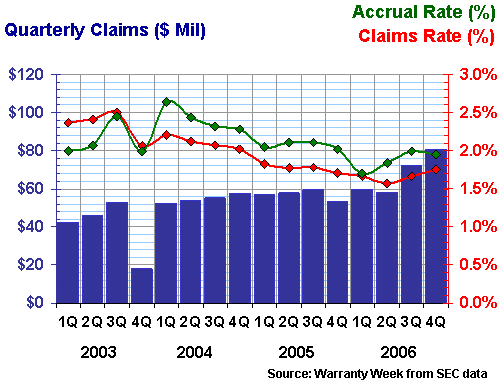
Notice that accruals have always been close but slightly above claims, and notice also that 11 of the past 16 quarters have come in between $50 and $60 million in claims paid. In 2006, Paccar paid out $43 million more in claims than in 2005, but its claims rate was little changed. That's a sure sign that claims are growing in proportion to sales.
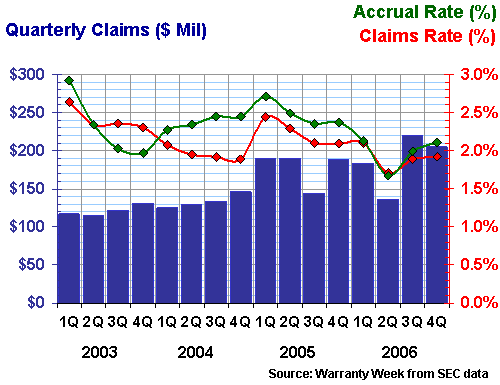
At Caterpillar, the product mix is a bit different, with engines for on-highway trucks and lots of off-road vehicles. Both Cat and Paccar have significant finance operations, but we've subtracted all of that revenue out from our calculations.
In terms of claims rates, Cat has seen more ups and downs than Paccar, but the general direction over time has been downward. The company is now enjoying its third consecutive quarter below 2% -- a feat it achieved in 2004 but could not in 2003 nor 2005. Notice how the claims and accrual rates have bonded so closely in recent quarters, after diverging significantly in earlier years. This we take as a sign that the company is not only more efficient with its spending, but also more accurate with its estimations.
Figure 6
Caterpillar Inc.
Warranty Claims & Accruals, 2003 to 2006
(in $m and % of Product Sales)
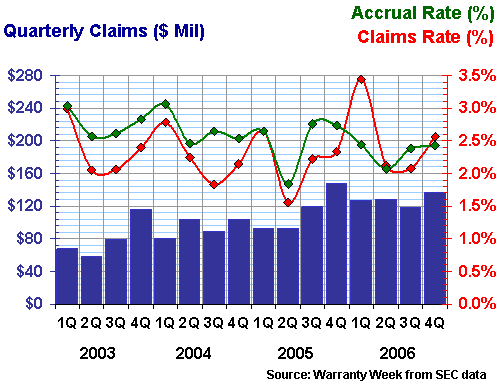
John Deere and Toro have always shown a highly seasonal pattern when it comes to warranty expense, which is no surprise given their lineups of farm and lawn equipment. Both see peaks in the first calendar quarter of each year, though the trough comes a bit later in the year for Deere than for Toro. This seems to have more to do with seasonal sales patterns at Deere, because there's no seasonality to the dollar amount of claims paid per quarter.
Figure 7
Deere & Co.
Warranty Claims & Accruals, 2003 to 2006
(in $m and % of Product Sales)
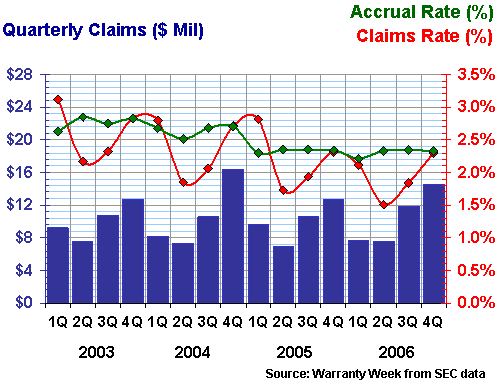
At Toro, the amount of claims paid during the fourth quarter of each year is greater than any of the three preceding quarters, which suggests that many customers put off their repairs until after the first frost (or that the most breakdowns occur late in the growing season). By the same measure, the fewest repairs are made in the second quarter of each year, just as sales begin to rev up.
Figure 8
Toro Co.
Warranty Claims & Accruals, 2003 to 2006
(in $m and % of Product Sales)
The seasonality seen in Harley-Davidson's warranty numbers also have something to do with the seasons, but one must also consider the timing of the beginning and end of model years. Customers who buy a new bike as soon as they're available will get in more months of riding before the cold weather sets in, but typically their one-year warranties are halfway to expiration by the time spring rolls around. So it's no surprise to see a spike in late spring and early summer, as customers see that deadline fast approaching.
Figure 9
Harley-Davidson Inc.
Warranty Claims & Accruals, 2003 to 2006
(in $m and % of Product Sales)
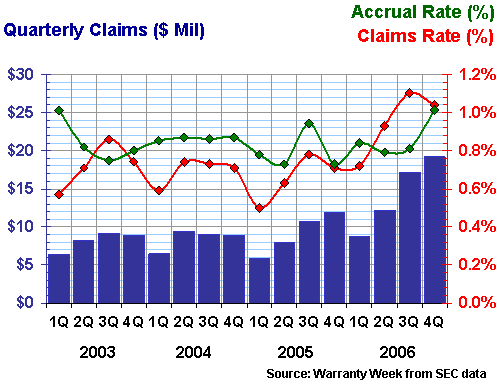
What's a little disturbing about the data in Figure 9 is the upward trend of the past two years. Claims rates have risen from 0.5% to 1.1% in that time frame. However, keep in mind that even 1.1% is below average for the small vehicle group that Harley is a major part of, and that 2.5% is more typical for vehicles in general. So in this case, things aren't so bad in comparison to others.
| Back to Part Six | Go to Part Eight |


