Computer & Peripheral Warranties:
At midyear, it looks like many of the major brand names continue to cut their warranty expenses, as do many of their suppliers. But soon Dell will restate its warranty accruals and that could erase the declines completely. Or will it add to them?
As a group, computer and peripheral manufacturers have not seen much change in their warranty expenses this year. However, a handful have seen big changes -- enough to tilt the overall payout into decline.
Looking at only U.S.-based computer OEMs, disk drive and data storage systems makers, telecom equipment manufacturers, semiconductor and printed circuit board makers, and associated peripherals, it is probable that warranty claims in the first half of 2007 actually declined somewhat.
Why the uncertainty? We're still not sure how much Dell Inc. is paying in warranty claims, because the company hasn't said a word about them since June 2006, when it filed its quarterly financial report for the period ending May 5, 2006. What it says about warranty when it files the late reports will determine whether the industry has seen its claims rise or fall in the past year.
Let's assume for this week that Dell continued paying the exact same amount of warranty claims during each of the past five quarters, and those amounts represented the exact same percentages of sales. As a group, everyone else is paying out less -- partially because they're cutting warranty expenses per unit, and partially because less units are being sold.
First, let's take a look at actual claims paid over the past 18 quarters. Figure 1 splits the universe of computer-related manufacturers into five categories. So far this year, the companies counted in these five segments have paid just under $5.1 billion in claims, down about 2.1% from the same period in 2006. It's not a large drop, but nevertheless it's a decline of $110 million.
Consumer-Facing Brand Names vs. Suppliers
By far the largest segment is the computer OEM group, which has historically accounted for more than half the total for the whole industry. As is seen in the automotive industry, when it comes to warranty the company with its brand name on the outside of the box ends up paying the most and the highest percentage.
What's surprising, however, is that computer OEMs have seen their warranty expenses drop by $34 million in the first half of 2007. It's not a large drop in terms of a $1.4 billion outlay per quarter, but still it's a drop. While Dell remains an unknown, Hewlett-Packard has continued to cut its warranty outlays, and that's having an effect on the whole segment.
Figure 1
Computer & Peripheral Manufacturers:
Quarterly Warranty Claims Paid, 2003 to 2007
(in $ millions)

Data storage system makers have also seen their collective warranty claims fall, from $285 million in the first half of 2006 to $283 million in the first half of 2007. Again, it's a very small drop -- less than 1% of the total -- but nevertheless it's a decline. And given that disk drive makers are generally lengthening their warranty durations, any decline is an unexpected gift.
Telecom equipment makers saw a more meaningful 12% decline in warranty claims paid during the first half of 2007, but at least half of that decline can be attributed to the disappearance of Lucent Technologies following its acquisition by the French company Alcatel. Before Lucent was acquired at the end of 2006, it was paying claims at the rate of more than $120 million per year. Those claims are still being paid, but now they're being paid by a foreign-based company that's not part of the U.S. total.
Semiconductor and printed circuit board manufacturers have also seen their claims total fall in 2007. And unlike in other sectors, where the absence of data from major players causes us to wonder whether the drop was real, in this segment there is no doubt that the decline took place. In the first half of 2007, the 85 companies in this segment saw their warranty expenses decline by more than 10% to $425 million.
The Microsoft Effect
The only segment to show an increase in claims paid was "peripherals and other." Last year, the group paid out $466 million during the first half. This year, so far they've paid out $578 million. And much of that $112 million rise can be traced to Microsoft Corp., but not for its computer peripherals as much as for its game consoles.
Microsoft has now begun complying with FASB Interpretation No. 45, revealing in its annual report for the year ended June 30 that it accrued $974 million and paid claims of $226 million during the period. That represented a significant jump from $45 million in accruals and $42 million in claims the year before. And it was enough to erase and reverse a 10% decline by others counted in this category.
What matters more than dollars paid, however, is the percentage of sales those payments represent. A 10% decline may look good on paper, but not if it happens at the same time that sales fall by 20%. In such a case, the percentage of sales consumed by warranty claims would have actually risen.
In Figure 2, we're taking the same five categories from Figure 1 and calculating what these amounts represented as a percentage of product sales. Computer OEMs, for instance, paid out $1.41 billion in claims during the second quarter of 2007, which represented 3.2% of their total product sales. More importantly, this amount represented the smallest percentage of overall product sales since the end of 2004.
Figure 2
Computer & Peripheral Manufacturers:
Quarterly Warranty Claims Paid, 2003 to 2007
(as a % of sales)

Computer OEMs, however, continue to pay out the highest percentage of their sales in warranty claims. Data storage vendors and telecom equipment makers pay out closer to 1.5% or 2% of their sales in warranty claims. Semiconductor and printed circuit board makers pay out around 1% of their revenue in warranty claims. And until Microsoft's Xbox problems erupted, peripheral manufacturers paid out an even lower percentage.
The computer OEM segment, though it consistently accounts for more than half of all high tech warranty claims, is really just a grouping of only 12 companies. In contrast, there are 88 active warranty providers in the semiconductor category and 95 active warranty providers in the telecom equipment category.
Like Ford & GM
In this industry, Dell and HP are like Ford and GM. Whatever happens to them affects the overall numbers significantly. In Figure 3, we've charted HP's warranty expense profile through the fiscal quarter ended July 31. Since they're about two months ahead of companies that follow a calendar quarter format, there are 19 quarters on the chart below to everyone else's 18.
Figure 3
Hewlett-Packard Co.
Quarterly Warranty Claims & Accruals, 2003 to 2007
(in $ millions and % of sales)
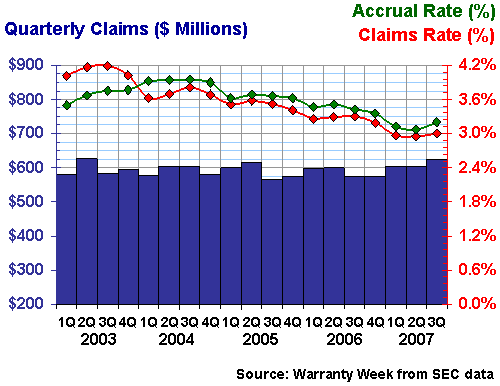
The good news is that claims came in at 3% of sales and accruals were only 3.2%. The bad news is that these are slightly above the numbers seen earlier in fiscal 2007, and the $625 million quarterly claims total is the second-highest of the past five years. Then again, Figure 3 makes clear that HP's warranty expenses have been on a steady downwards trend for much of that time.
Dell, meanwhile, has announced that its accounting investigation is now complete, and that its financial reports will soon be restated for the past several years. That almost certainly means the data in Figure 4 will have to be replaced. But it remains to be seen whether the numbers go up or down.
Figure 4
Dell Inc.
Quarterly Warranty Claims & Accruals, 2003 to 2007
(in $ millions and % of sales)
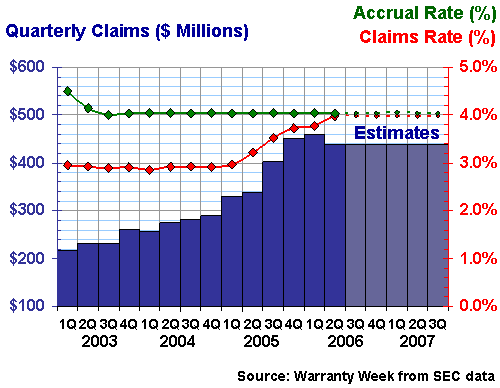
We've shaded the past five quarters to signify that these are placeholder estimates that simply carry forward the last known figures into the present. However, notice also that the line for accruals flattened out long ago at around 4%. This happened because at that time Dell began mixing extended warranty revenue in with its product warranty accruals, making it impossible for outsiders to tell the two apart.
If the restatement once again separates these figures into two different buckets, we wouldn't be surprised to see accruals rising from 4% to 5% in 2005 in much the same way that claims rose from 3% to 4% during that same time period. But all of that is speculation, and it doesn't even begin to tackle the question of what happened in 2006 and 2007. Dell has promised to file its late financial reports by November, if not sooner. When they do, we'll replace these guesses with real data.
Comparing Incomparables
Speaking of real data, Figures 5 and 6 spotlight two arch-rivals in the disk drive industry: Seagate Technology and Western Digital. In the July 17 newsletter we tracked the before and after merger experience of Seagate and Maxtor. Figure 5 adds a quarter of data to the mix that suggests there was a peak in early 2007. Still, the current 2.6% claims rate is Seagate's second-highest of the past five years.
Figure 5
Seagate Technology
Quarterly Warranty Claims & Accruals, 2003 to 2007
(in $ millions and % of sales)
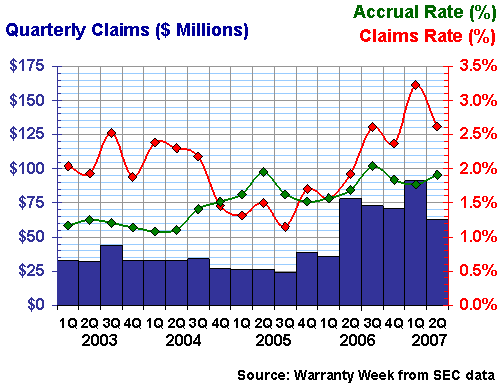
In terms of good news, the $63 million paid out during the second quarter of 2007 was the smallest quarterly amount reported since the Maxtor acquisition. But it's still more than twice as much as Seagate paid out on its own before the merger.
One cannot easily compare one company to another without knowing all the components that they do and do not count as warranty expense. However, just a glance at Figure 6 reveals that Western Digital is more accustomed to claims rates well under 2%, and sometimes under 1% of sales. That doesn't mean its products are better or cost less to repair or anything of the sort. But in this case, while Seagate is trending upwards following a merger, Western Digital is trending downwards.
Figure 6
Western Digital Corp.
Quarterly Warranty Claims & Accruals, 2003 to 2007
(in $ millions and % of sales)
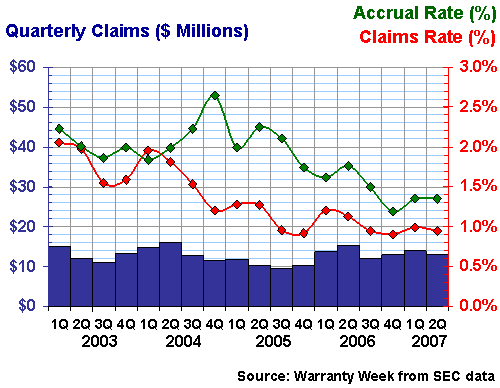
Through much of 2003 and 2004, the claims rates of the two companies were very close together. But then in 2005, they diverged, and after the Maxtor acquisition, the gap widened significantly. Again, one cannot easily compare the claims rates of two companies over time, but in this case the divergence is quite noticeable.
Forgetting Warranty?
In the case of Honeywell International, the trend was noticeably upward in 2006, but then the company ceased providing quarterly updates. Last year, the aerospace and semiconductor manufacturer reported a sudden jump in claims from $27 million in the second quarter to $95 million in the third quarter. And then in the fourth quarter, claims remained high at $77 million.
Figure 7
Honeywell International Inc.
Quarterly Warranty Claims & Accruals, 2003 to 2007
(in $ millions and % of sales)
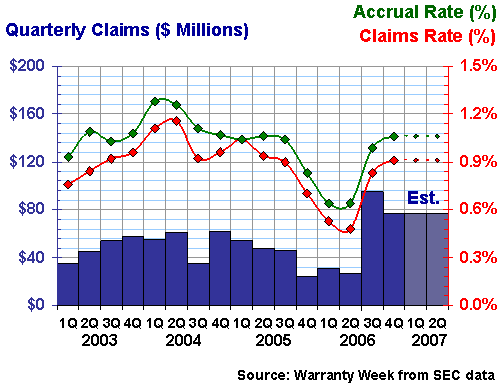
But then the data stopped coming. There was no warranty data at all in the first or second quarter financial reports. And there was no explanation for its absence. One would think that shareholders would have demanded to know what happened after the midyear spike in claims. But then again, they weren't given an explanation for that either.
It's not until you calculate warranty as a percentage of sales and plot it in a chart that you see how volatile Honeywell's warranty expenses were in late 2005 and all of 2006. And now there's no data. In this case, no news is definitely not good news.
High Percentages With Printers
Finally, it's been a while since we spotlighted the warranty expenses of Lexmark International. That's because readers are usually shocked to see the chart of a company that regularly sets aside upwards of 11% of its revenue to finance future warranty claims. For most companies, anything higher than 5% is a crisis.
But Lexmark isn't just any company. It's a computer printer manufacturer, and the printer industry follows its own very peculiar economic model. Two-thirds of Lexmark's revenue comes from sales of supplies and consumables. Only a third comes from sales of actual printer hardware. And since the warranty calculations subtract out all the consumables, the percentages look unusually high.
Figure 8
Lexmark International Inc.
Quarterly Warranty Claims & Accruals, 2003 to 2007
(in $ millions and % of sales)
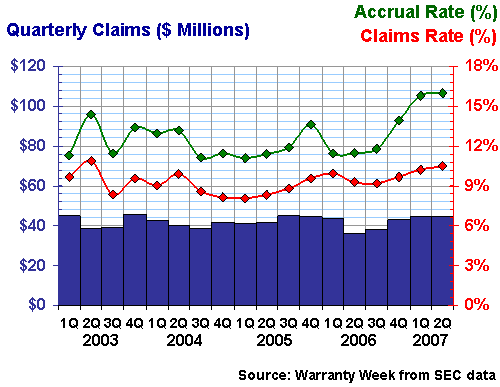
We suspect that the numbers are just about the same at HP's printer division. But those numbers are averaged in with all the other HP divisions, resulting in the 3% overall figure for the company as a whole. At Lexmark, however, that's all there is. And that means 16% accrual rates and 10% or 11% claims rates.
As a percentage of total revenue, including consumables, Lexmark's warranty numbers aren't so freakishly high. We also suspect that the printer hardware is selling at a low price in order to spur sales of the more profitable consumables.
And considering that the presence of a warranty actually helps keep a customer happy and keeps them buying consumables, what looks like a high expense is really just an investment in an ongoing revenue stream. Despite these seemingly high percentages, Lexmark remains a solidly profitable company.


