New Home & Appliance Warranties:
At the midpoint of 2007, sales are falling faster than claims can be reduced, driving claims rate percentages upwards for many companies in the building trades. But unlike in the automotive or computer industries, claims in this sector were always rather evenly distributed among new home builders and their suppliers.
Rounding out our midyear 2007 product warranty report, this week we take a look at the new home, appliance, tools, fixtures, and furniture industries. For lack of a better term for all the ingredients that go into the making of a home or office, let's call this sector of the warranty landscape the building trades.
The September 11 newsletter looked at the automotive sector while the September 18 edition looked at the computer and telecom equipment sector. In both those cases, the well-known brand names -- the consumer-facing OEMs -- ended up paying the lion's share of the warranty claims, while their suppliers paid noticeably less.
This is decidedly not the case in the building trades. The 32 publicly-held companies building new homes and reporting warranty expenses in their financial filings paid out only 18% of the $2.5 billion spent on claims this year by all manufacturers in the building sector. In contrast, the 42 publicly-held manufacturers of heating, ventilation, air conditioning, refrigeration, food preparation, and other appliances accounted for just over half the total, and the 73 companies manufacturing warranted building materials, tools, fixtures, and furniture accounted for just under a third of the total.
Figure 1
New Home Builders, HVAC, Appliance & Furniture Manufacturers:
Quarterly Warranty Claims Paid, 2003 to 2007
(in $ millions)

Some of these companies are also counted in either the automotive, aerospace, or computer sectors, so it would not be quite accurate to say that the building trades account for about 17% of the overall $14.4 billion in first half claims total reported by all U.S.-based manufacturers. Because the product lines of some companies straddle multiple sectors, it would be impossible to assign such a definite share to each sector. But in round numbers, automotive is about half the total so far, while computers/electronics are around a third and the building trades described here have a share in the low-to-mid teens. Everything else -- aerospace, sports equipment, mining equipment and other warranted products -- comprise the single-digit-percentage remainder.
Percentages vs. Dollars
More important than their share of the total warranty pie is the relative percentage of product revenue each category of warranty consumes. Most manufacturers spend anywhere from 1% to 5% of their total product revenue on warranty claims, though a significant number spend less than 1% and a handful spend more than 5%. The weighted average for all manufacturers continues to meander around 1.8%, though the median is somewhat lower.
The pattern seen in the auto and computer industries is that the consumer-facing brands such as Ford and Dell are the ones with warranty spending rates towards the middle to high end of that scale, while their suppliers are usually found towards the low end of it. That is not the case in the building trades.
As can be seen in Figure 2, during most of the past four years the HVAC and appliance companies paid out the highest percentage of their revenue to honor warranty claims, while the companies making building materials, fixtures and furniture usually paid the least. The new home builders were usually somewhere in the middle, though this year their claims rates have soared.
Figure 2
New Home Builders, HVAC, Appliance & Furniture Manufacturers:
Quarterly Warranty Claims Paid, 2003 to 2007
(as a % of sales)

Warranty Week took a detailed look at this phenomenon in the August 8 newsletter, finding that it had more to do with declining home sales than with soaring claims costs. Indeed, Figure 1 shows that new home warranty claims as measured in dollars are actually down so far this year, to $446 million for the first half of 2007 from $514 million in the first half of 2006. But the claims rate as of the middle of the year was up from 1% in June 2006 to 1.3% in June 2007, because of falling sales.
Makers of HVAC systems and other appliances paid out nearly $1.28 billion during the first half of 2007, but their collective claims rate at the midpoint of 2007 was only 1.17%. Makers of building materials, fixtures and furniture stood at $800 million for the first half of 2007, with a claims rate of 0.9%.
Like Strands of a Rope
But as Figure 2 illustrates, the three sectors have more or less been tangled like strands of rope for the past 18 quarters. New home builders had the highest claims rate eight times, while HVAC/appliances came out on top nine times and the building materials sector took the lead by a nose once, during the third quarter of 2003.
Each of these three sectors is a simple weighted average of the companies within it. The weighted average of all three sectors is slightly below 1%, meaning that the typical company engaged in the building trades spends around 1% of its product revenue on warranty claims. There's quite a bit of variation around this average, but as we'll see, it's a typical claims rate for several of the largest brand names in the business.
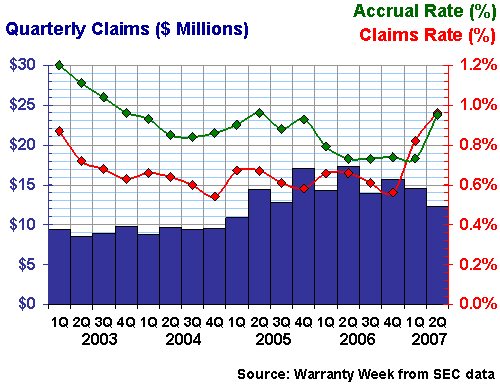
In the August 8 newsletter, we spotlighted D.R. Horton and Pulte Homes. This time around, we'll take a closer look at KB Home and Lennar Corp. In Figure 3, it's clear that KB Home's claims and accrual rate are now climbing (the red and green lines, respectively). Yet the blue bars make it clear that the claims total in dollars is actually falling. The unseen factor, of course, is falling sales.
Figure 3
KB Home
Quarterly Warranty Claims & Accruals, 2003 to 2007
(in $ millions and % of sales)
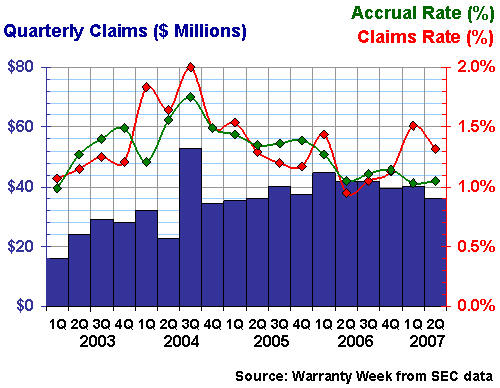
In Figure 4, we can see that Lennar's claims have also fallen off, though the claims rate percentage is up, once again because of falling sales. But notice that the company has managed to keep its accruals more or less constant at 1.1% despite the sales decline. Also notice that both the claims and accrual rates have been intertwined for much of the past four years. Both these traits are signs of a well-managed warranty department.
Figure 4
Lennar Corp.
Quarterly Warranty Claims & Accruals, 2003 to 2007
(in $ millions and % of sales)
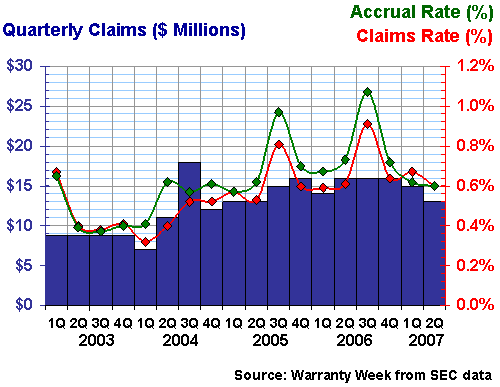
In the building materials sector, sales are also down, though not by as much as is the case with new homes. At Masco, for instance, sales of the company's faucets, cabinets, locks, and other gear are down around 6%. But the claims and accrual rates, instead of rising, have actually fallen slightly, meaning that claims paid and accruals made were cut by slightly more than 6% over the same period.
Figure 5 details how Masco paid only $28 million in claims during the first half of 2007, down from $30 million in the first half of 2006. As of the end of June 2007, though, the company's claims and accrual rates were both at 0.6%, derived by dividing that $28 million total by the corresponding sales figure of $4.68 billion.
Figure 5
Masco Corp.
Quarterly Warranty Claims & Accruals, 2003 to 2007
(in $ millions and % of sales)
The story is not much different at Fortune Brands, though both the revenue and claims numbers are somewhat lower and the percentages are somewhat higher. Much of the company's revenue is derived from non-warranted sources such as alcoholic beverages, so these product sales must be subtracted out of the percentage calculations. Still, that leaves $2.2 billion in first half sales, to be divided into almost $20 million in claims, for an 0.9% claims rate.
Figure 6
Fortune Brands Inc.
Quarterly Warranty Claims & Accruals, 2003 to 2007
(in $ millions and % of sales)
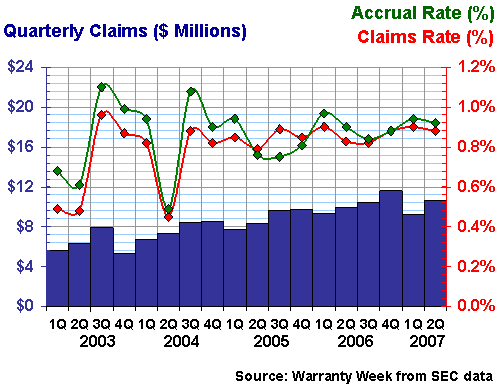
Fortune's warranted product sales are down only 2% for the half-year, and its claims and accrual rates are much steadier, in a narrow range of 0.8% to 1.0%. La-Z-Boy, meanwhile, has seen sales of its furniture fall by 16% in the fiscal year ended April 28. Yet its claims and accrual rates have risen by only a few tenths of a percentage point, as can be seen in Figure 7.
Figure 7
La-Z-Boy Inc.
Quarterly Warranty Claims & Accruals, 2003 to 2007
(in $ millions and % of sales)
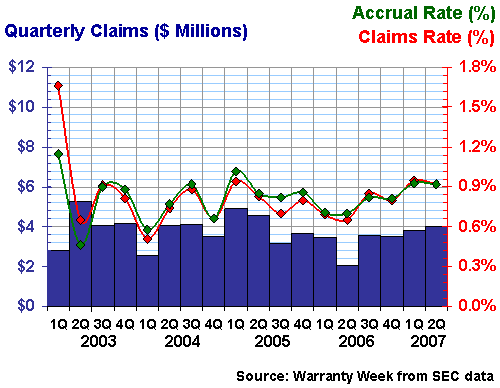
A year ago, La-Z-Boy's claims rate was 0.6% and its accrual rate was 0.7%. Now both are at 0.9%. Given such a large decline in sales, that's not much of an increase. Claims of $12.4 million in fiscal 2006 rose to $14.9 million in fiscal 2007, while sales fell from $1.9 billion to $1.6 billion.
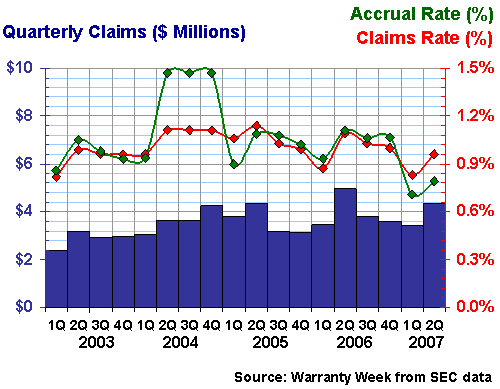
Sealy Corp., a major bedding manufacturer, has shown more volatility than most in its warranty expenditures. Back in 2004 its accrual rate approached 1.5% while in 2007 it's been closer to 0.7%. The claims rate, however, has somehow managed to stay close to 1%. This is all the more amazing given that the accrual rate can be managed and adjusted than the claims rate. The accrual rate is what you make happen while the claims rate is what happens to you.
Figure 8
Sealy Corp.
Quarterly Warranty Claims & Accruals, 2003 to 2007
(in $ millions and % of sales)
Switching gears, if you'll pardon the pun, to the mechanical sector of the building trades, we'll take a look at three representative manufacturers of heating and cooling systems. Lennox makes central heating and air conditioning units for buildings. Fedders is best-known for its room air conditioners, though its product line is actually much wider. And TurboChef is an up-and-coming manufacturer of commercial ovens.
Lennox has demonstrated an ability to maintain its warranty expense ratios within a very narrow range, not only by closely monitoring claims and adjusting accruals, but also by maintaining constant quality levels. It's so predictable: the company puts aside around 1% of its revenue to finance future warranty claims, and warranty claims consume around 1% of revenue.
Figure 9
Lennox International Inc.
Quarterly Warranty Claims & Accruals, 2003 to 2007
(in $ millions and % of sales)

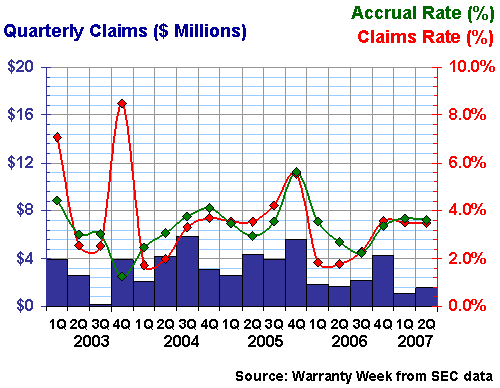
It hasn't been so predictable for Fedders, with claims ranging from 1.7% of sales to 8.5% of sales over the past four years. Actually, those extremes were set in back-to-back quarters. Sales in the first half of 2007 are down 61% from 2006, though claims have also fallen from $3.5 million to $2.6 million during the same period. The saddest news is that the company filed for bankruptcy protection from its creditors on August 22.
Figure 10
Fedders Corp.
Quarterly Warranty Claims & Accruals, 2003 to 2007
(in $ millions and % of sales)
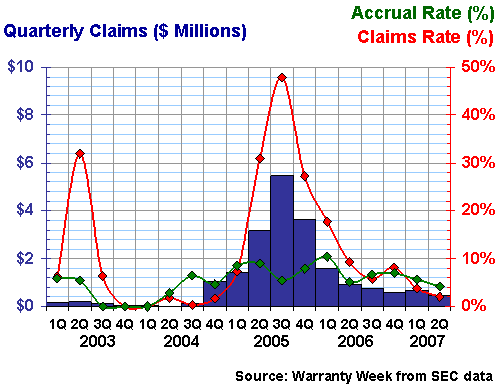
TurboChef, meanwhile, continues to amaze observers with its ability to absorb warranty shocks that would have closed down most other small companies. As can be seen in Figure 11, there was a point on this roller coaster ride at which almost half the company's sales revenue was going back out the door to finance warranty repairs of its commercial ovens.
Now the claims rate is down to a more manageable 2% level, and sales are once again growing by leaps and bounds. But this time around the company won't be so reliant upon one customer.
Figure 11
TurboChef Technologies Inc.
Quarterly Warranty Claims & Accruals, 2003 to 2007
(in $ millions and % of sales)
The company's problems began when the Subway sandwich chain became envious of the heated sandwiches served by rival Quiznos. TurboChef made a quick-heating oven that was just perfect for Subway's sandwiches, and so thousands of storefronts rushed to install their own units. After an initial surge in sales, orders declined.
Meanwhile, the heated sandwiches were a big hit with customers. The quick-heating ovens were used so heavily that they required frequent repairs. And they were so new that most of those repairs came in as warranty claims. So what happens when claims soar just as sales plummet? Your claims rate goes to 48%.
Now, however, some of that first batch of ovens are being replaced, and TurboChef has diversified its customer base so it's no longer so reliant upon Subway. Only 19% of its sales now come from that sandwich vendor, and sales to other commercial customers besides Subway have more than tripled.


