Five-Year Warranty Trends, Part Two:
While several of the biggest warranty spenders have compiled remarkably consistent results since 2003 in terms of the percentage of revenue they spend on warranty work, others have managed to reduce their costs considerably over time. And then there are the handful that saw costs rise by remarkably high amounts.
Over the past five years, US-based manufacturers have spent an average of 1.7% of their product revenue on warranty claims, and have set aside slightly more than 1.7% each quarter to pay for future warranty claims.
These rates have been remarkably stable since 2003, never veering by more than 0.15% above or below the long-term average. For individual companies, however, it's a different story.
In last week's newsletter, we took the top 100 warranty providers, as measured by their warranty spending in calendar 2007, and calculated the rate of change for claims and accruals from the end of 2006 to the end of 2007.
This week, we're taking that same list of 100 companies, and comparing the claims and accrual rates for each to their long term averages for the 20 quarters between 2003 and 2007. We wanted to see if the largest warranty providers also keep very close to their long term averages, or if the relatively flat line turned in by all of them as a group is itself something of an anomaly.
Staying Within A Narrow Band
Here's what we found: 37 of the top 100 ended 2007 with a claims rate within 10% of their long term average, and 38 of the 100 ended 2007 with an accrual rate that was within a band of plus or minus 10% of their long term averages.
A total of 22 companies were within plus or minus 10% for both their claims and accrual rate, including such heavyweights as Ford, General Motors, Caterpillar, Cummins, Deere, and Textron. So congratulations are in order for them, for showing the world that long term warranty stability is possible.
However, it's when we look outside the 10% band that things get interesting. Basically, there are two directions for them to go: most saw their claims and/or accrual rate fall by more than 10% under its long term average, while fewer saw either or both rates rise.
In Figure 1, we've ranked the ten biggest declines in claims rates, comparing the end of 2007 to the five-year average seen in 2003 through 2007. In Figure 3, we've done the same for accrual rates. Figures 2 and 4 are snapshots of one of the top ten companies, to give everyone an image of what all these numbers mean. And then Figures 5 through 8 reverse the process, showing companies unlucky enough to end 2007 with their warranty costs on the upswing.
As was the case with last week's data, there are numerous reasons for these rises and falls besides changes in product quality or warranty costs. Since the claims and accrual rates are computed by dividing warranty by sales revenue, they can fluctuate seasonally or year to year based on sales patterns alone. They're also changed by mergers, acquisitions, divestitures, new product launches, and the phase-out of old product lines.
Problems Figuring Percentage Rates
In Figure 1, for instance, the reason GE is at the top is because the company keeps changing the segments of its business that are subject to warranty costs. In 2003, the segment generating warranty expenses was called "Power Systems," but in 2004 it was widened and renamed "Energy." And then since 2005 it's been widened further, to two segments called "Infrastructure" and "Health Care."
The result is an ever-enlarging pool of revenue compared to slowly shrinking warranty costs, and as seen in the chart below, a claims rate that's now well below the company's five-year average. However, we'll be the first to say that the average itself is meaningless, because the 4% to 5% rates seen in 2003-2004 bear little relationship to the 1% rates seen in 2006-2007.
Figure 1
Top 100 U.S.-based Warranty Providers:
Top Ten Claims Rate Reductions,
End 2007 vs. 2003-2007 Average
(in percent)
| Five Year | Claims | Above/ | |
| Claims | Rate | Below | |
| Company | Average | End 2007 | 5 Yr. Avg. |
| General Electric Co. | 2.8% | 0.76% | -72% |
| L-3 Communications | 2.1% | 0.69% | -67% |
| Thermo Fisher Scientific | 0.89% | 0.39% | -56% |
| Western Digital Corp. | 1.3% | 0.77% | -41% |
| Juniper Networks Inc. | 2.8% | 1.7% | -38% |
| Harman International | 1.2% | 0.76% | -35% |
| Apple Inc. | 1.5% | 0.98% | -34% |
| Medtronic Inc. | 0.26% | 0.18% | -34% |
| Rockwell Collins Inc. | 1.9% | 1.3% | -31% |
| Eaton Corp. | 0.80% | 0.56% | -30% |
At L-3 Communications, the story is simply that claims and accruals swing wildly from very low rates at the end of the year to very high rates in the middle of the year. And since we're comparing the end of 2007 to the long term average, it just so happens that we measured the company at the trough of its latest cycle.
Thermo Fisher is the result of a merger between Thermo Electron Corp. and Fisher Scientific International Inc. at the end of 2006. Before that merger took place, Thermo Electron had a higher claims rate than it does now, somewhat above its long term average of 0.89%. Now it's spending money on warranty claims at less than half that rate, because the numbers now include Fisher Scientific's revenue.
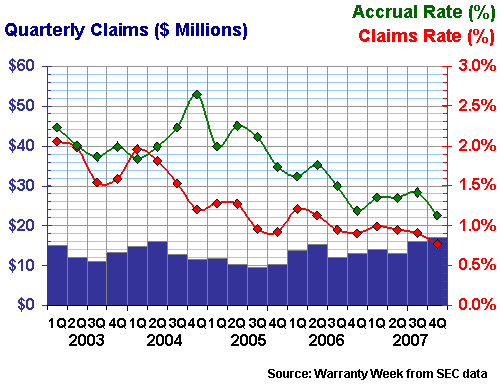
It isn't until we get to Western Digital that we find a case of a company that has actually cut its warranty costs the old fashioned way: by selling more and spending less. Claims last year topped $60 million -- the most ever -- but revenue grew even faster, even as warranty durations grew longer in the disk drive industry.
In Figure 2, we've graphed this decline, with the claims rate colored red and the accrual rate colored green. One look at the slope of these downward trends, and it's no surprise to find that Western Digital also made the top ten in Figure 3, which lists the ten largest accrual rate declines.
Figure 2
Western Digital Corp.
Claims & Accrual Rates, 2003 to 2007
(in $ millions and percent)
Some of the same companies occupy the top of both Figures 1 and 3, for the same reasons: mergers, acquisitions, revenue segmentation, etc. In fact, seven companies made both lists, which obviously suggests that claims and accruals tend to move together. For these seven, claims and accruals each moved by more than 30% below their long term averages.
Also, as mentioned above, for 22 companies claims and accruals moved by less than 10% above or below their long term averages. Down below, five companies listed in Figures 5 and 7 saw claims and accruals each increase by enough for them to make both top ten lists. And there were no companies that made two top ten lists in opposite directions (1 & 7 or 3 & 5).
This means that a significant number of companies were at the fringes or in the middle of the distribution, meaning that claims and accruals tend to move in tandem. While in Figure 2 there was a significant gap between Western Digital's claims and accrual rates, both continued to head in the downward direction over the past five years.
Figure 3
Top 100 U.S.-based Warranty Providers:
Top Ten Accrual Rate Reductions,
End 2007 vs. 2003-2007 Average
(in percent)
| Five Year | Accrual | Above/ | |
| Accrual | Rate | Below | |
| Company | Average | End 2007 | 5 Yr. Avg. |
| General Electric Co. | 2.5% | 0.85% | -66% |
| L-3 Communications | 1.8% | 0.70% | -62% |
| Thermo Fisher Scientific | 1.0% | 0.42% | -59% |
| Beazer Homes | 1.4% | 0.57% | -58% |
| Eaton Corp. | 0.83% | 0.44% | -47% |
| Apple Inc. | 1.8% | 1.1% | -42% |
| Juniper Networks Inc. | 3.0% | 1.9% | -38% |
| Western Digital Corp. | 1.8% | 1.1% | -37% |
| KLA-Tencor Corp. | 3.1% | 2.1% | -33% |
| TRW Automotive Holdings | 0.46% | 0.32% | -30% |
Beazer Homes has missed the filing deadline for its past three financial statements, so with our place-saving estimates we can't be sure if the drop seen at the beginning of 2007 has been sustained throughout the year. Eaton releases its warranty expenditures only once a year, so rather than 20 quarterly measurements, we're averaging only five annual measurements. Still, the trend has been downwards for both claims and accruals.
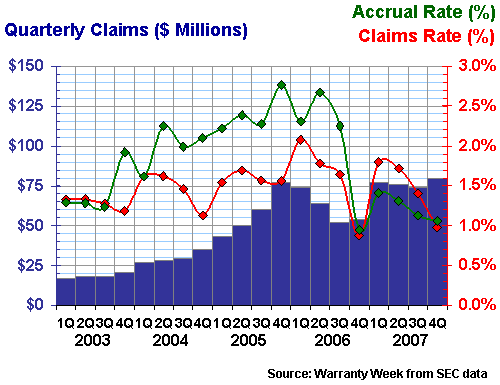
Apple is a company has cut its claims and accrual rates significantly over the past five years. Or, as is revealed in Figure 4, it had some problems in calendar 2005 and 2006 that were largely behind it by calendar 2007. And if one remembers the headlines of those years, they were filled with allegations of battery failures and cracked screens that have largely fallen out of the news in recent months. Whatever quality "events" afflicted the product line two or three years ago are no longer causing expenses to rise.
Figure 4
Apple Inc.
Claims & Accrual Rates, 2003 to 2007
(in $ millions and percent)
So that's the good half of the news. The second half of the story is filled with companies that for one reason or another are now at the high end of their warranty cost curves. It's no surprise to see Microsoft at the top -- and it would have made the top of Figure 7 also if not for the simple fact that there's not enough accrual data from the pre-Xbox 360 years to calculate an average for the company.
Those that made both of the top ten increase lists include BorgWarner, Hovnanian Enterprises, Briggs & Stratton, Tyco International, and Jarden. Tyco of course is a divestiture story, where the two spin-offs took with them more revenue and less warranty expense than was left behind with the parent. The other four have some explaining to do to their investors, because warranty costs for them are way up.
Hovnanian Enterprises, like most homebuilders, can point to declining sales as the culprit. But that explains away only half of the equation: the rising claims rate. For if one assumes that each newly-constructed home will accrue $2,400 in warranty claims over the life of its warranty, less sales should mean less accruals. So if the accrual rate was 0.7% in 2006, why was it 1.6% last year? Why is Hovnanian now accruing $5,400 per home sold?
Figure 5
Top 100 U.S.-based Warranty Providers:
Top Ten Claims Rate Increases,
End 2007 vs. 2003-2007 Average
(in percent)
| Five Year | Claims | Above/ | |
| Claims | Rate | Below | |
| Company | Average | End 2007 | 5 Yr. Avg. |
| Microsoft Corp. | 1.1% | 6.2% | +467% |
| BorgWarner Inc. | 0.44% | 1.0% | +135% |
| D.R. Horton Inc. | 0.39% | 0.70% | +82% |
| Hovnanian Enterprises | 0.57% | 1.0% | +81% |
| Briggs & Stratton Corp. | 2.2% | 3.8% | +74% |
| Palm Inc. | 5.1% | 8.6% | +69% |
| Tyco International Ltd. | 0.43% | 0.64% | +50% |
| Jarden Corp. | 2.4% | 3.5% | +46% |
| Harley-Davidson Inc. | 0.85% | 1.2% | +45% |
| ArvinMeritor Inc. | 0.70% | 0.96% | +37% |
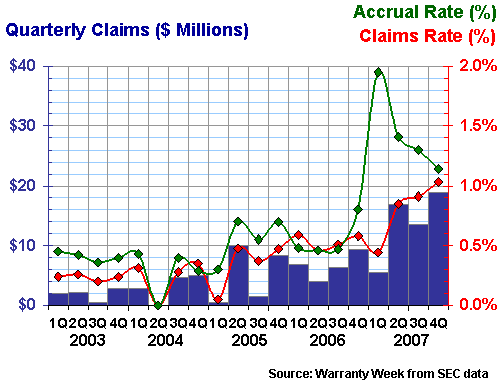
BorgWarner has been quite public about its warranty woes, announcing the reasons behind the increases in several press releases as well as in its financial statements. So there's no reason to rehash them here, except to note that the product in question is no longer in production.
But what's interesting is to see it happen in a chart, with four years of stability followed by one year of sharp increases. Notice how accruals spiked before claims, suggesting that the company saw it coming and prepared for the worst. Notice also that while accruals climbed to unprecedented levels, they eventually fell back to just above the rising claims rate. In other words, it never got as bad as was predicted.
Figure 6
BorgWarner Inc.
Claims & Accrual Rates, 2003 to 2007
(in $ millions and percent)
Accrual rate increases, as noted above with Hovnanian, are hard to explain away. It shouldn't be affected by sales volumes alone. It could be impacted by new product launches, or by acquisitions of product lines that naturally have higher warranty costs. Or it could be caused by deteriorating quality.
Merger-Related Increases
Johnson Controls is most likely on the list because in 2005 it acquired an HVAC company that was accruing for warranty at a rate nearly ten times as high as the parent was at the time of the merger. So of course the company is now running accruals at a rate far above its 2003-2007 average. The more important question is whether current accrual rates are normal given its current product line. And it seems like it is, although it's difficult for an external observer to segment its warranty expenses into HVAC and non-HVAC buckets.
Two other automotive parts suppliers made the list -- Delphi and Visteon -- which lends weight to the theory that warranty costs are rising in this segment. Or more precisely, these companies are increasing their accruals in advance of warranty costs rising, so that the money is there when it's needed.
Figure 7
Top 100 U.S.-based Warranty Providers:
Top Ten Accrual Rate Increases,
End 2007 vs. 2003-2007 Average
(in percent)
| Five Year | Accrual | Above/ | |
| Accrual | Rate | Below | |
| Company | Average | End 2007 | 5 Yr. Avg. |
| Delphi Corp. | 0.58% | 1.3% | +124% |
| Briggs & Stratton Corp. | 1.9% | 3.8% | +99% |
| Hovnanian Enterprises | 0.90% | 1.6% | +79% |
| BorgWarner Inc. | 0.66% | 1.1% | +72% |
| Visteon Corp. | 0.26% | 0.43% | +65% |
| Tyco International Ltd. | 0.16% | 0.26% | +62% |
| Jarden Corp. | 2.1% | 3.4% | +60% |
| Johnson Controls Inc. | 0.30% | 0.48% | +58% |
| Lexmark International | 14% | 19% | +38% |
| Mohawk Industries | 1.2% | 1.6% | +34% |
Briggs & Stratton is best known for its lawn mowers and generators, as well as its engines. But it also makes snow blowers, power washers, water pumps, and other outdoor power equipment. No doubt, this outdoor orientation is behind the highly seasonal pattern seen in Figure 8.
Figure 8
Briggs & Stratton Corp.
Claims & Accrual Rates, 2003 to 2007
(in $ millions and percent)
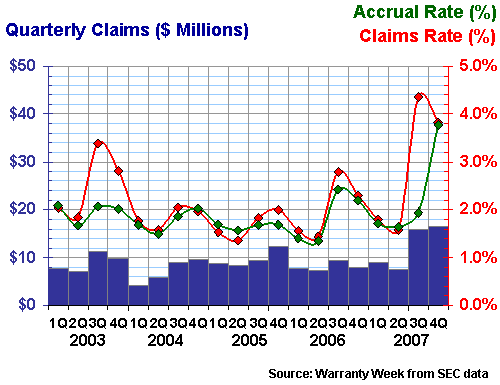
However, the recent rise seems to have more to do with problems in one specific product line: the snow blower engines. A recall announced in June 2007 impacted approximately 480,000 snow throwers sold nationwide by dealers from June 2000 through February 2007. The company initially estimated the total cost of this recall to be around $5 million, but subsequently revised it up to the neighborhood of $20 to $25 million. The rise in warranty costs seen in the second half of 2007 is no doubt the result.
So at least in the cases of BorgWarner and Briggs & Stratton, the reasons behind the sharp recent increases have been made public. As was the case with Apple and its iPods a few years ago, the key is to recognize the problems early, announce them, account for them, and prevent them from happening again.
Go to Part One
This Is Part Two
Go to Part Three
Go to Part Four
Go to Part Five
Go to Part Six


