

Five-Year Warranty Trends, Part Three:
Measured in dollars, claims were up by only $400 million last year (+1.4% since 2006) while accruals rose $1.5 billion (+5.5%) since 2006. But Microsoft's Xbox 360 debacle accounted for much of those increases in a year that saw warranty expenses decrease or remain the same for manufacturers in many industries.
Take away the Xbox, and the evidence suggests that most American manufacturers and most of the warranty-issuing industries are getting their warranty expenses under control after years of sometimes sharp increases in costs.
It would take at least three newsletters to present all the data we have for you this week, and it would take three more to fit in the data we're saving for next week. Thanks to new accounting rules that came into force right at the end of 2002, most manufacturers have now published five years of detailed warranty data that we're just beginning to mine.
Below are nine charts that follow the course of warranty claims and accruals over the years 2003 through 2007. Click on any of the charts below and a new Web page will open where you can see sixteen more charts that present the same data in a slightly different format.
This week, the figures are all in dollars, which tells only the first part of the story. Next week, we'll compare all these dollar figures to product revenue to calculate a percentage of sales for each. For while claims and accruals continue to increase in terms of dollars, so do sales (in most cases). And while it's interesting to note that American manufacturers paid out $402 million more to satisfy warranty claims in 2007 than they did in 2006, what may be more interesting is the fact that in both cases this amount represented roughly 1.6% of product sales. That means claims are rising proportionally to sales. So are accruals.
This Week's Data Dump
But that's the story to be told next week. This week, the first group of four charts below illustrate the amount of warranty claims paid annually in each of 14 different industries. The second group of four charts do the same for warranty accruals -- the amounts set aside each year in a reserve fund to finance the payment of future warranty claims. The ninth and final chart is simply a gateway to a whole series of pie charts that are posted on a separate Web page.
Let's start with warranty claims. As mentioned, from 2006 to 2007 claims counted in dollars increased yet the claims rate remained unchanged. Let's show where some of those dollar increases came from.
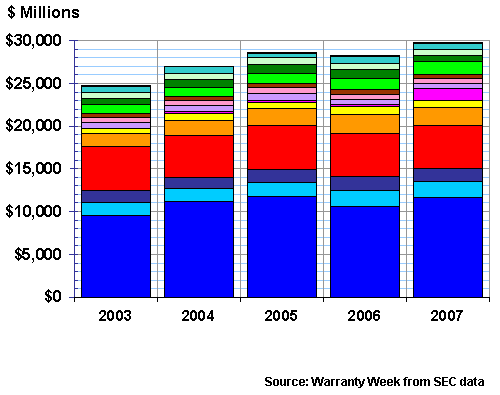
Figure 1 shows the claims totals for 14 different industries, which cover most sources of warranty claims. Largest among them is the sector of automotive OEMs, in which we include all land transportation vehicle makers, regardless of whether they're making two-seat golf carts or two-storey farm equipment. Second-largest among them are the computer OEMs, which to us includes everything from hand-held units to giant mainframes.
It's important to note that all manufacturers are assigned to one and only one of the 14 sectors. If they make both airplanes and air conditioners, we assigned them to the category in which they make the most revenue. All but a handful of sports equipment, jewelry, security, petrochemical, and mining equipment companies fit into one of the 14 categories, so the "other" category is barely noticeable.
Figure 1
All U.S. Manufacturers
Claims Paid per Industry, 2003 to 2007
(in $ millions per year)
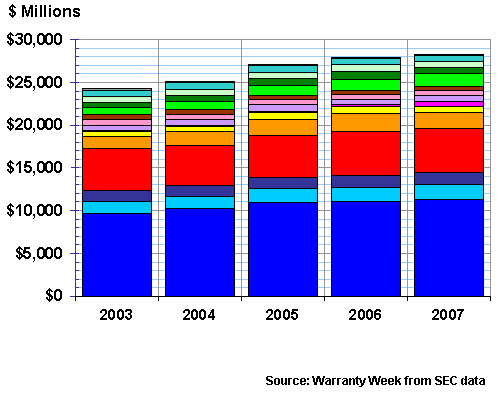
For a better view, we grouped together industries into three clusters: transportation, high tech, and buildings. This is where things get even more arbitrary. We included aerospace and marine manufacturers in the "transportation" category, and we included consumer electronics, medical equipment, and scientific tools in the "high tech" category.
That leaves everything else -- appliances, HVAC, furniture, fixtures, office equipment, building materials, construction tools, power generators, and the actual homes themselves -- for the "building" category. However, all of the wheeled construction vehicles -- what most would call "heavy equipment" is included in the automotive OEM category alongside all the trucks, buses, and other large on-road vehicles.
Consistent Color Codes Used
Keep in mind that we're using the same color code in all of these charts. So all the transportation sectors are shades of blue, all the high tech sectors are reddish, and all the building sectors are greenish. We'll keep to the same color scheme next week also, hopefully making it easier to pair these dollar comparisons with those percentage comparisons.
When a large warranty provider such as United Technologies is moved from the air conditioning to the aerospace category, it has a noticeable effect on the size of each. In fact, we used to count consumer electronics in the "other" category, because so little was made by American companies (as opposed to European or Asian brands). But then along came the Xbox 360 and suddenly warranty in the CE sector was a billion-dollar headache for American manufacturers (well, at least one of them).
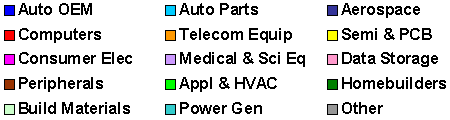
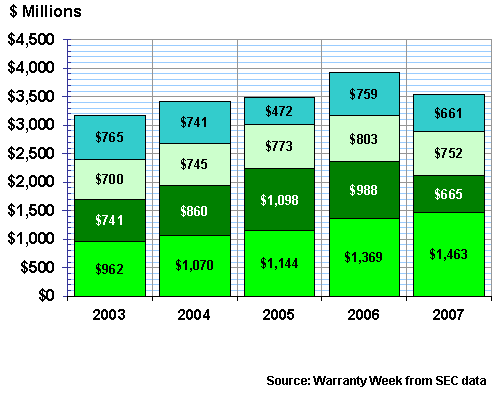
Knowing how many different kinds of vehicles are included in the transportation chart below doesn't alter the fact that most of the warranty expense comes from good old-fashioned passenger cars and light trucks made by Ford or General Motors. Because Chrysler is private and because brands such as Toyota, Honda, and Volkswagen are based outside the U.S., we're counting less than half the U.S. passenger car market here. But since only U.S.-based and publicly-held companies are required to disclose their quarterly and annual warranty expenses, that's all we have.
Figure 2
U.S. Transportation Manufacturers
Claims Paid, 2003 to 2007
(in $ millions per year)
The automotive OEMs usually account for about 40% of all warranty claims, and they are usually seeing their claims grow at or close to the average for all manufacturers. From 2006 to 2007, however, they saw claims grow by 2.1% and accruals grow by 9.1%, somewhat ahead of the respective all-manufacturer 1.4% and 5.4% averages for claims and accruals. From 2004 to 2005 and from 2005 to 2006, however, this segment grew in size at below-average rates.
Claims are what happens to you after you sell a product. Accruals are what you believe will happen to you in the future. So if you expect more claims in the future, you'll increase accruals now. If you increase accruals by more than sales rise -- essentially accruing more money per vehicle sold -- you're signaling that you expect claims to rise in the years ahead. This is what the auto OEMs are signaling. Whether they're right or not won't be clear until a few years hence.
Balance of Payments in Warranty?
The aerospace category includes just the commercial operations of manufacturers such as General Dynamics and Boeing. In general, military projects have their own way of accounting for repair costs, allowing major defense contractors such as Lockheed Martin and Northrop Grumman to report not a dollar of warranty spending. In addition, none of the warranty costs of importers such as Embraer or Airbus are included here. So although these folks are spending upwards of $1.5 billion a year on warranty claims, in reality the total would be much higher if it included both imports and military.
Then again, in all these charts we're counting the worldwide spend of American manufacturers. So the question is, does the amount spent overseas on warranty claims by Boeing exceed the amount spent within the U.S. by Airbus and Embraer? Is there a positive or a negative balance of payments?
Same question for Ford and GM: does the amount they spend on warranty claims in their export markets exceed the amount spent by importers on the vehicles they sell within the U.S.? What is the balance of payments for warranty claims?
We'd suspect it's negative in the transportation sector (imports exceed exports), positive in the high tech sector (especially with computers), and close to neutral in the building sector. But we'll leave the details for a future article.
The aerospace segment saw claims rise by 8% while accruals actually fell by 5% (see Figure 6). Conversely, the auto parts segment saw claims fall while accruals rose.
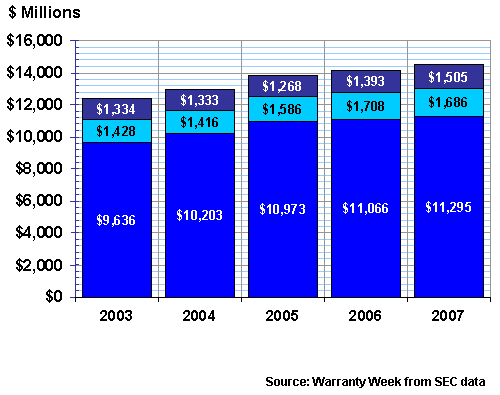
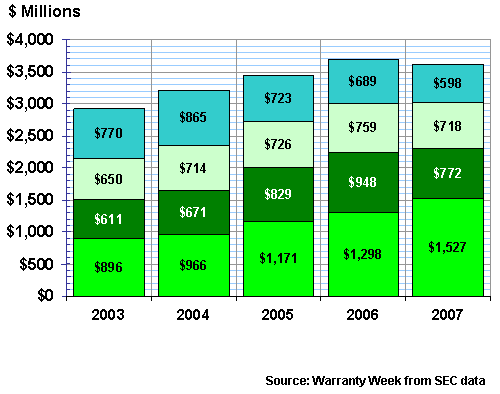
In Figure 3, you'll see the depiction of the seven sectors we're grouping together under the heading of high tech. Of these seven, all but the consumer electronics category actually saw claims fall in 2007. All but CE and peripherals saw accruals fall from 2006 to 2007.
Figure 3
U.S. High Tech Manufacturers
Claims Paid, 2003 to 2007
(in $ millions per year)
Computer manufacturers paid out the most -- more than $5 billion for the second year in a row -- but their total was down by some $40 million year over year. Accruals, meanwhile, fell by only two million dollars but remained above $5 billion for the third year in a row and the fourth of the past five years.
In Figure 4, we're grouping together the remaining four categories that have something to do with the building and/or furnishing of homes and offices. The "appliance" category includes both consumer and commercial units, used for purposes such as heating, cooling, cooking, and cleaning.
The homebuilder category includes just the 30 or so public companies that build residences. It does not count the significantly larger privately-held homebuilding industry, nor does it count the numerous builders of roads, bridges, water projects, and other public works (who interestingly haven't reported even a dollar of warranty spending over the past five years).
Figure 4
U.S. Building Manufacturers
Claims Paid, 2003 to 2007
(in $ millions per year)
Appliance and HVAC makers hold the distinction of being in the only category to see both claims and accruals grow at a faster rate than the industry average in every year we can measure. In 2007, this group saw claims rise by 18% while accruals rose by 7%. But even without the exact percentages, just a look at the data in Figures 4 and 8 clearly show a significant annual increase.
Warranty accruals for all manufacturers rose by 5.4% to $29.8 billion in 2007. This of course means that accruals made exceeded claims paid, which in turn means that warranty reserves expanded as more funds arrived than departed. In general, though, this has been the case during each of the past five years, simply because on average sales have been growing. Sell more units, make more accruals.
Accruals Don't Always Exceed Claims
That has not always the case in every industry, however. For instance, in the 14 categories we're using, only half saw accruals exceed claims in 2003. But that was a peculiar year, because most manufacturers were only beginning to pay more attention to their own and their competitor's warranty disclosures. In each of the four other years, accruals have exceeded claims in 11 out of the 14 possibilities. However, in each of these years the three exceptions have occurred in different industries (with only the data storage and appliance/HVAC categories scoring two exceptions each).
A comparison of Figure 5 to Figure 1 shows by how much accruals usually exceed claims. In 2007 the total imbalance was more than $1.5 billion. But in 2004 and 2005 it was even larger. And in no year has the gap been smaller than $400 million. So perhaps it's no shock to find that warranty reserve balances have grown steadily from $34.7 billion in early 2003 to $39.1 billion by the end of 2007.
Figure 5
All U.S. Manufacturers
Accruals Made, 2003 to 2007
(in $ millions per year)
Looking at just the transportation group (Figure 6), accruals grew by a higher than average rate to more than a $15 billion total, but that was primarily thanks to the aforementioned 9% growth for the OEMs. Parts makers increased accruals by only 3% (a below average increase) and aerospace manufacturers actually reduced their accruals by 5%.
Interestingly, aerospace manufacturers as a group saw claims rise by significant amounts in both 2006 and 2007. In 2006 they responded by increasing their accruals by more than $200 million over 2005 levels. But in a completely counterintuitive move, they cut accruals by more than $80 million in 2007.
Figure 6
U.S. Transportation Manufacturers
Accruals Made, 2003 to 2007
(in $ millions per year)

Within the high tech sector (Figure 7), five of the seven categories saw accruals shrink in 2007 while only CE and peripherals makers saw increases. Yet the category as a whole saw 9% growth, thanks primarily to Microsoft's increased accruals for the Xbox 360.
The Xbox Factor
It's amazing how one company can skew the results so dramatically. But here's how it happened: The high tech group as a whole saw an increase in accruals of $938 million from 2006 to 2007. But Microsoft alone increased its warranty accruals from only $45 million in calendar 2006 to more than $1.22 billion in calendar 2007. So that more than wiped out the $280 million decrease collectively reported by the hundreds of manufacturers that fall into one of these seven industry categories.
Figure 7
U.S. High Tech Manufacturers
Accruals Made, 2003 to 2007
(in $ millions per year)
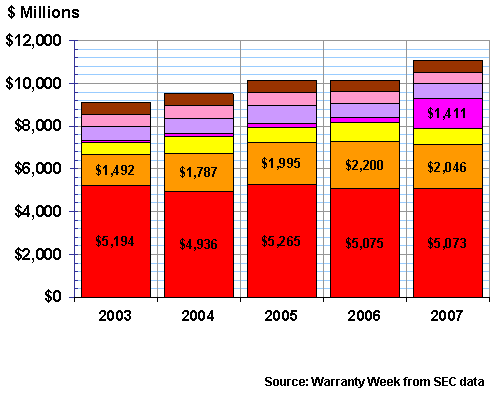
In the building industry, it's no surprise that both claims and accruals fell in 2007, no doubt because of a massive slowdown in sales. Less units means less accruals, and in the homebuilding category in particular, a lot less accruals. After a 10% fall in 2006 (to $988 million), accruals among homebuilders fell another $323 million in 2007. That brought them below even 2003 levels!
Figure 8
U.S. Building Manufacturers
Accruals Made, 2003 to 2007
(in $ millions per year)
HVAC and appliance makers, meanwhile, have seen their accruals rise by more than $500 million since 2003. As the data in Figure 8 suggests, this category has been expanding at a higher than average rate year after year. What's more, there have been significant departures from this category (Goodman went private again; York became part of an auto parts maker). That means everybody else increased their accruals by a great deal more than the industry average.
Finally, we have ten pie charts to show you, but to save space only one is included below. Figure 9 illustrates the relative spending of the 14 different industries on warranty claims in 2007.
Figure 9
All U.S. Manufacturers
Claims Paid per Industry, 2007
(as a % of $28.5 billion total)
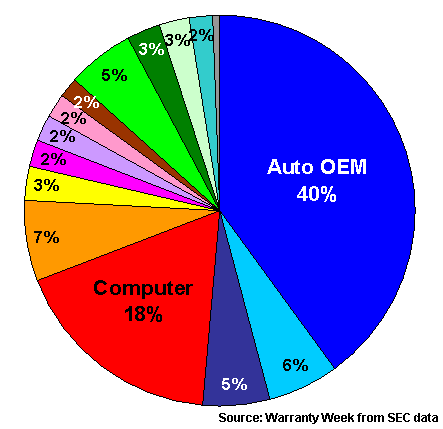
Click on the image above to see a series of ten pie charts containing not only the claims totals for 2003 through 2007, but also the accruals totals for the five years between 2003 and 2007. It's basically the same data contained in Figures 1 & 5, presented in a different format.
As can be seen in the series of pie charts, automotive OEMs have accounted for right around 40% of both claims and accruals during all five of the years between 2003 and 2007. Computer OEMs have seen their share vary from 17% to 21% over the same five-year period.
The only other really noticeable change over the years is within the consumer electronics category, again caused solely by Microsoft's Xbox 360 experience. In a sector where very little besides speakers, headsets, and jukeboxes are sold by U.S.-based manufacturers, the sudden addition of almost half a billion dollars in claims and more than a billion dollars in accruals really leaves its mark.
Go to Part One
Go to Part Two
This Is Part Three
Go to Part Four
Go to Part Five
Go to Part Six


