Aerospace Warranties:
Unlike most other industries, aviation product manufacturers didn't see radical changes in their warranty costs during the recession. Yes, there were plenty of ups and downs, but they tended to be tied to new product cycles rather than to the economy.
The amount of warranty expense reported by major aerospace manufacturers hasn't changed much in recent years, though sales have boomed and busted during that time.
It appears as if many of the companies in the industry are getting a much firmer grip on their warranty expense, controlling it within a tighter range and making it more predictable in size. This tends to flatten out the curves, though the way we draw them with elongated axes they'll still look volatile.
In Figure 1, for instance, there are plenty of jagged edges in the graph that tracks warranty claims spending from 2003 to the middle of 2010, a 30-quarter period. In two or three weeks we shall be able to add a thirty-first column, as third quarter 2010 data begins to arrive later this month.
No Obvious Downturn
In contrast to most other manufacturing industries, there is no obvious downturn in the aerospace industry warranty data. The seven-year peak came in the first quarter of 2008, when aerospace manufacturers paid out $475 million in claims. But the total was over $440 million in both the first and last quarters of 2009. And at no time in recent years has the industry's claims total fallen below the $350 million per quarter threshold where it spent all of 2005 and 2006.
Figure 1
Aerospace Warranty Claims Paid, 2003-2010
(in US $ millions per quarter)

Accrual figures tell a similar story: what recession? In fact, what the data in Figure 2 suggests is that there have been three or four spikes in the last five years where accruals rose above a $350 million per quarter baseline, with the highest peak of $512 million coming in the final quarter of 2007.
The second-highest peak was $480 million in the fourth quarter of 2006, while the third-highest peak was the $454 million total at the end of 2009. The lowest quarterly total for accruals came in 2003, though there does seem to be a bit of a trough in the 2008 and 2009 data.
Figure 2
Aerospace Warranty Accruals Made, 2003-2010
(in US $ millions per quarter)

Of course, sales have been slow during the last few years, with none of the top 10 aerospace warranty providers turning in anything better than a 9% sales gain in 2010. And that sales prize goes to Garmin Ltd., a navigation device manufacturer that might be a better fit in the consumer electronics or perhaps the telecom equipment category.
Sales Gains & Declines
Among the major manufacturers and warranty providers that everyone would agree belong in the aerospace category, Rockwell Collins Inc. led with a 4% sales gain, followed by United Technologies Corp. with a 2% sales gain and Goodrich Corp. with a 1% gain. L-3 Communications, Textron, General Dynamics, Boeing, and Harris have each registered sales declines in 2010 so far.
The reason we mention this is because claims divided by sales equals the claims rate, and accruals divided by sales equals the accrual rate. Both ratios are charted in Figure 3. And while they look both a bit chaotic and a bit seasonal, the ratios have for years been in a fairly tight range of 0.7% to 0.9%.
Figure 3
Aerospace Warranty Claims & Accrual Rates, 2003-2010
(as a percentage of product revenue)

For some reason, the highest claims and accrual rates seen in the aerospace industry both occurred in the last quarter of 2003. Claims consumed 1.15% of sales while accruals consumed 1.13% of sales.
And then the ratios dipped below 0.7% in the first quarters of 2005, 2006, and 2007. They remained above that threshold in the first quarters of 2008 and 2009, though one can still see the annual dips in the data from those years. Note that the 2010 data breaks the mold, with no seasonal pattern in evidence.
Avionics & Navigation Focus
Usually, when we take a snapshot of the aerospace industry, we include the warranty claims and accrual data for a couple of the top OEMs such as Boeing, Textron, and General Dynamics. This time around, we'd like to do something a little different and bypass the big names in favor of five manufacturers of avionics and navigation gear.
Let's begin with Garmin. As mentioned, the company saw sales rise 9% in the second quarter of 2010. But as also mentioned, the company crosses over into consumer electronics markets. Its GPS navigation devices are sold for cars, trucks, boats and motorcycles. Garmin also sells standalone hand-held navigation devices, including some aimed at runners and bicycle riders. Plus it sells navigation systems for Android and Blackberry mobile phones.
But in addition to all these consumer products, Garmin also sells a wide range of avionics systems for small aircraft and helicopters. Granted, that product line accounted for only about 8% of sales last year, compared to nearly 70% for automotive, 6% for marine, and the rest for outdoor fitness devices. But in the first half of 2010, aviation systems accounted for 11% of sales, and 13% of operating income.
Unfortunately, the company's warranty statistics don't separate claims or accruals by product line. So there's really no way for an external observer to tell what might have caused that mammoth spike in claims seen in Figure 5 below.
Figure 4
Garmin Ltd.
Warranty Claims & Accrual Rates, 2003-2010
(as a percentage of product revenue)
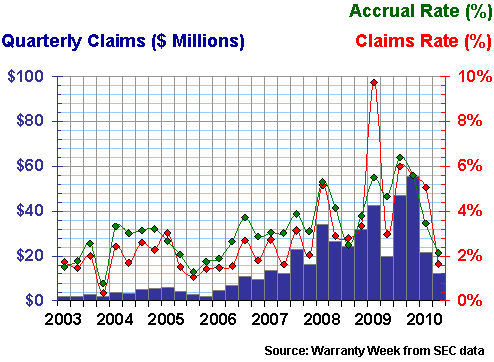
The most obvious excuse is that Garmin always seems to have a slow first quarter. Sales dropped below $500 million in the first quarters of both 2009 and 2010, as well as in 2007. So that drives up the claims rate all by itself, even if the claims total remains the same.
But notice that claims were higher than usual in three of the four quarters of 2009, and peaked at $55.5 million in the final quarter of that year. And in that first quarter of 2009 when the claims rate hit 9.7%, the claims total was a higher-than-usual $42.5 million (sales revenue was $431 million). So it was really a combination of higher-than-usual claims and lower-than-usual sales.
We'd also add that several other handheld device companies suffer from uncomfortably high claims rates, perhaps because clumsy customers insist that their accidental droppages should be covered by warranty. However, we would consider anything above 5% to be uncomfortably high, and Garmin's claims rate exceeded that level in five of the last 10 quarters.
Steady Progress in Cost Reduction
Rockwell Collins is much more of a mainstream avionics supplier and is much less involved with either consumers or handhelds. For commercial airlines, it offers avionics, information management solutions, pilot controls and actuation systems, training and simulation solutions, and passenger connectivity and in-flight entertainment systems.
But whatever it sells, the story that's told in Figure 5 is one of a continuous reduction in warranty costs. Back in 2003, the company's claims rate was above three percent. In 2004, it fell below 2.5%. In 2005, it fell below 2.0%. In 2006, it fell below 1.5%. And then finally, it hit rock bottom in 2008 at 1.2%.
Figure 5
Rockwell Collins Inc.
Warranty Claims & Accrual Rates, 2003-2010
(as a percentage of product revenue)
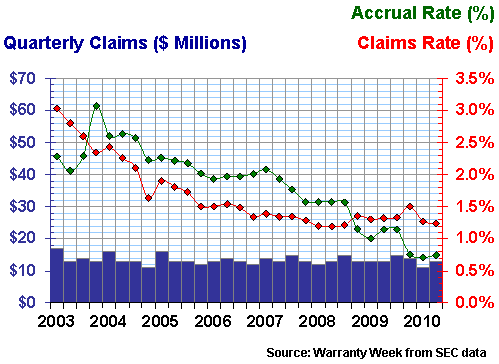
Notice how the accrual rate declines in an almost parallel fashion over the same period. That in itself is a mark of good warranty management, in that it suggests that the amounts being set aside for future expenses turn out to be close to the actual expenses. The lines don't need to be on top of each other, but the gap between them should not be large.
Like its claims rate, Rockwell Collins' accrual rate was briefly above three percent in 2003. It's been below two percent in every quarter since 2007. And it dipped to an incredible 0.7% earlier this year. That's less than one-fourth the rate it was at seven years ago. Whatever the company's warranty operation is doing, it's evidently doing it very well.
Another Downward Trend
Crane Company describes itself as "a diversified manufacturer of highly engineered industrial products with a substantial presence in a number of focused niche markets." The Aerospace Group is the one that gets the company onto this week's list. That part of Crane makes landing gear and flight control systems, luxury passenger seats, and pumps for fuel, water, and coolant.
Crane has actually seen product sales fall 2% in the first half of 2010. Aerospace product sales fell by 9%, and their contribution to the company's total sales fell from 27% to 25%. But the Aerospace Group saw profits rise as engineering expenses fell, thanks primarily to its successful completion of the development work on the Boeing 787 brake control and monitoring system.
As can be seen below in Figure 6, the company has also been able to reduce its overall warranty expense significantly in 2010. Claims fell to 0.34% while accruals hit a new low of 0.37%.
Figure 6
Crane Co.
Warranty Claims & Accrual Rates, 2003-2010
(as a percentage of product revenue)
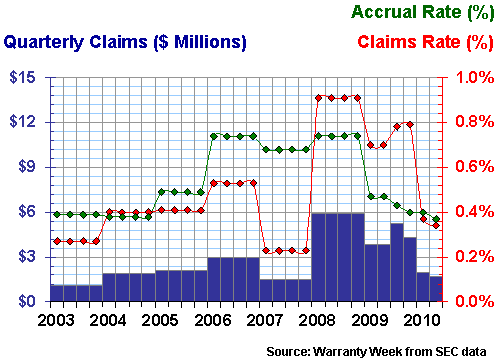
Notice how the data looks like stair steps for the years 2003 to 2008. During that time, Crane reported its warranty expenses only once a year, so we calculated an annual rate and applied it to all four quarters within a given year. But then in 2009, Crane began including warranty data in all its quarterly reports, so this annual averaging was no longer necessary.
In two years -- 2003 and 2007 -- Crane reported claims figures that were lower than they are in 2010. And in both 2003 and 2004, its accrual rate was only fractionally higher than it is now. But it's also apparent after six quarterly measurements that the downward trend is real this time, and not just the result of an annual averaging.
Keeping Warranty Costs Low
Teledyne Technologies makes a wide assortment of systems and components for both commercial aviation and defense customers. Sales were up 5% in the first half of 2010, but that didn't seem to have much of an effect on warranty expenses. As can be seen in Figure 7, both the claims and accrual rates have remained in a tight range of 0.4% to 0.6% of sales for the past two years.
Figure 7
Teledyne Technologies Inc.
Warranty Claims & Accrual Rates, 2003-2010
(as a percentage of product revenue)
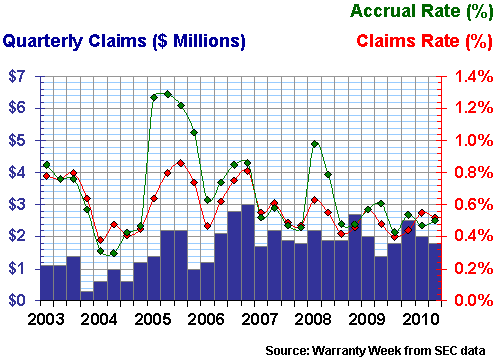
Teledyne has seen its claims rate pop up above 0.8% three times in the past seven and a half years, and has seen its accrual rate exceed that level four times since 2003. But except for that 2005 episode, these jumps have been of relatively short duration. For the half-year ended July 4, 2010, Teledyne reported paying $3.8 million in claims and making $3.7 million in accruals, on $736 million in product sales, which translates into a pair of 0.5% claims and accrual rates.
Finally, we wanted to take a look at L-3 Communications, which of our five snapshots this week has the most variability in its warranty data. Yes, Garmin had that spike up to 9.7% last year, and yes Rockwell Collins has greatly reduced the percentage of sales revenue consumed by warranty expenses. But L-3 has seen its claims and/or accrual rates drop from above 6% to below 1% in the same year.
A Tale of Two Companies?
We drew Figure 8 using a logarithmic scale so that all this data could fit onto one chart. The reason for doing this is that it really looks like two companies' data. There's the highly volatile L-3 Communications of 2003 to 2005, and the steady-as-she-goes L-3 Communications of 2006 to 2010.
It's as if the company suddenly got its warranty process under control. For the last 20 consecutive quarters, neither the company's claims rate nor its accrual rate have exceeded one percent. They're both very close to that mark now, but only after a long, slow rise. The warranty data no longer looks like a bouncing ball.
Figure 8
L-3 Communications
Warranty Claims & Accrual Rates, 2003-2010
(as a percentage of product revenue)
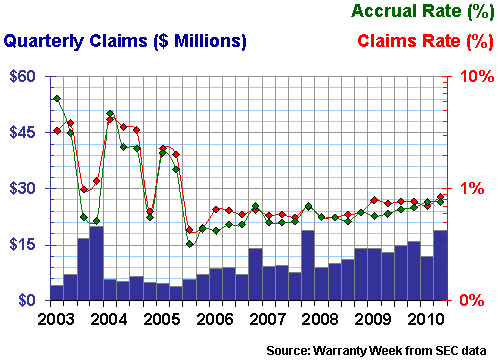
L-3's product sales were actually down by 0.3% in the half-year ended June 25, 2010. Claims rose from $27 million to $31 million, and accruals rose from $22 million to $28 million. At the half-year mark, the company's claims rate stood at 0.9% and its accrual rate was 0.8%.
End of the Half-Year
This is the last in a series of mid-year reports for the warranty industry. That's not because we've run out of industry segments to analyze. It's because November is traditionally the beginning of the period in which manufacturers publish their third quarter data. So while we have a few more segments to profile, we'll be using nine months of data to do the job from now on.
For the record, all U.S.-based manufacturers in all industries reported $11.3 billion in claims and $10.7 billion in accruals during the first half of 2010. That represents a decline of about 10% for claims, and an increase of about 10% for accruals. Product sales for all manufacturers are up by about 20% for the same period. And warranty reserves have declined by about $3.1 billion to an industry-wide total of $32.4 billion as of June 30, 2010.
Product Warranty Series
This is the sixth in a series of 11 industry-by-industry newsletters that examine product warranty claims and accrual trends in detail over the past eight years. Links to the others in the series are included below, in case you've missed any.
September 16: Computer Warranty Claims & AccrualsSeptember 23: Data Storage Warranties
October 7: HVAC & Appliance Warranties
October 14: New Home Builders & RV Maker Warranties
October 21: Construction Equipment Warranties
November 5: Aerospace Warranties
November 11: Security Equipment Warranties
November 18: Automotive OEM Warranties
December 2: Automotive Supplier Warranties
December 16: Medical & Scientific Equipment Warranties
December 23: Telecom Equipment Warranties


