


Thirteenth Annual Product Warranty Report:
As the latest charts clearly show, American manufacturers are spending less on warranty than they used to. But is it because of better products, less costly repairs, or fewer sales? Now that the 2015 warranty expense data collection is almost complete, it's time to figure out why claims and accruals are declining.
For ten straight years, American manufacturers cut their warranty expenses by improving the efficiency of the process, boosting product quality, and using data analysis to spot patterns of failure that could be eliminated. But in the past three years, the trend has been no trend.
Every year since 2003, Warranty Week has rounded up the latest warranty expense data, calculating totals and averages for all manufacturers and for specific industries. This week's report will focus on the top-level numbers for all industries, more than on the individual manufacturers. In the weeks ahead, we will focus more heavily on all those individual companies, in one industry at a time. This week, we'll report just some of the highlights and headlines.
Warranty Totals
As of now, with the latest data available from the manufacturers themselves, claims payments in 2015 were down around $211 million to $26.5 billion. That's a decline of around 0.8% since 2014.
Warranty accruals were down a much steeper $3.4 billion, to $25.1 billion, a decline of more than 12%. And warranty reserves were down by $1.0 billion to $43.5 billion, a decline of 2.3% since the year before.
A few dozen companies have yet to file their year-end financial reports, and they're expected to report an additional $40 million in claims and $40 million in accruals, which may alter these totals slightly. But it won't change the percentages by much at all.
After discussions with an actuary who shall remain nameless, we're making one big change. Because FCA US LLC, the former Chrysler Group, ceased reporting its own warranty expenses in the third quarter of 2015, and because its warranty expenses continue to be consolidated into the reports of its parent, Fiat Chrysler Automobiles N.V., all the Chrysler warranty data from the 2009 to 2015 totals has been removed. The company will be classified as a non-U.S.-based warranty provider, and will be part of an international warranty analysis later this spring. But it's not part of these totals or averages this week.
Methodology
Over the past 13 years, we've tracked some 1,235 different public companies that at some point reported either paying claims or making warranty accruals. Less than half of them still report doing so, because of numerous mergers, acquisitions, liquidations, management buyouts, or other reasons that took the others off the list. But we've retained the old data, and still include it in our totals and averages for years past.
Since the beginning, we've classified all the warranty providers into one of 14 different industries, such as automotive, appliances, or computers. And then everything else went into the "other" category. But then several years ago, we took all the companies in the "other" category and moved them into one of three new classifications: material handling, security equipment, or sports equipment. And the latter became the new home for all sorts of unusual warranty providers such as companies selling coins, luggage, sunglasses, watches, jewelry and footwear. So now there is no more "other" category.
We collect three warranty metrics from each company: the amount of warranty claims paid in calendar 2015, the amount of accruals made during the year, and the closing balance in their warranty reserve fund at the end of the year. All of these companies are nominally U.S.-based companies filing this data with the Securities and Exchange Commission in Form 10-K annual reports, though some of them have moved, merged, and reincorporated themselves in Bermuda, Ireland, or some other tax haven. The point is, all this data is from their SEC filings.
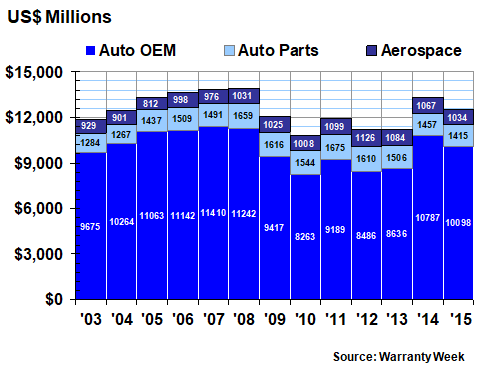
In Figure 1, we're looking at the worldwide claims payments of all the U.S.-based warranty providers over the past 13 years. The automotive OEMs account for more than 38% of the $26.5 billion total, followed by the computer OEMs at 25% and the appliance manufacturers at 6.7%. When it comes to product warranties, those are the industries with the highest expenses.
Figure 1
Worldwide Warranty Claims
of U.S.-based Companies
(claims paid in US$ millions, 2003-2015)
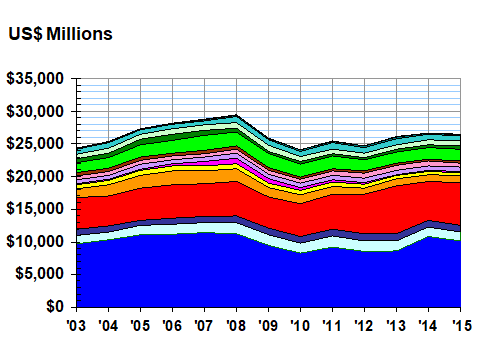
Of the 17 industry categories, only seven saw any growth in claims payments last year: appliances, computer peripherals, computer OEMs, consumer electronics, homebuilders, sports equipment, and telecom equipment. The 10 other industry categories saw claims fall, led by automotive OEMs, data storage, material handling equipment, medical and scientific equipment, and security systems.
It's always difficult to figure out whether a decline is good or not. Warranty is an expense, so less of it is usually a good thing. But if there's less of it because of fewer sales or shorter warranties, that's not a good thing. Conversely, if expenses are rising because of soaring product sales, that could be a good thing.
Automotive OEM claims fell because of the decline in recall expenses from 2014 levels. So they're recovering from unusually high costs in the past, getting back to the historic averages. Computer OEM claims rose because this category is still the home of Apple Inc., even though the vast majority of their product sales come from the iPhone rather than the Macintosh. And smartphone sales are soaring.
Warranty Accruals
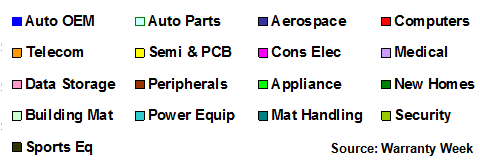
The same three industries also account for the vast majority of warranty accruals: automotive OEMs, computer OEMs, and appliance manufacturers. In Figure 2, those three industries are color-coded in dark blue, red, and bright green, in order to make them stand out.
Figure 2
Worldwide Warranty Accruals
of U.S.-based Companies
(accruals made in US$ millions, 2003-2015)
Of the $3.4 billion overall decline in accruals last year, almost $2.8 billion was contributed by the automotive OEMs, who were recovering from a rough year in 2014. For instance, GM cut its accruals from $5.5 billion in 2014 to $3.3 billion in 2015. Another $687 million came out of the computer OEMs, and $271 million came out of the aerospace industry. Among the industries to see the largest increases were the appliance makers with a $192 million rise in accruals, triggered primarily by a big increase at Whirlpool, which in turn was caused by a dryer recall.
Overall, 10 industry categories saw declines in accruals while seven saw gains. Besides the automotive OEMs, the biggest losers were the aerospace, building materials, data storage, and material handling companies. Besides appliances, the biggest gainers were sports equipment, homebuilders, and semiconductor makers.
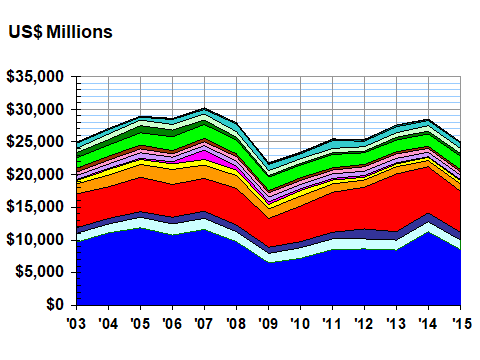
Warranty Reserves
Warranty reserves set a record at the end of 2014, but declined by $1.0 billion last year. Still, it's the second-highest total ever measured. The balance at the end of 2015 was just over $43.5 billion, a 2.3% reduction from the previous year. But it's more than $8.5 billion above the recessionary bottom seen in 2009 and 2010.
Figure 3
Worldwide Warranty Reserves
of U.S.-based Companies
(reserves held in US$ millions, 2003-2015)
Of the 17 industry categories, 10 saw a decline in reserves while seven saw an increase. The automotive OEMs again led the declines, with a $1.26 billion drop in reserves, which was spread among many of the top OEMs. The power generation equipment manufacturers led the increases with a $507 million rise, which was primarily caused by a big jump in GE's warranty reserve balance.
Other industries that saw big declines in their warranty reserves included computer peripherals, security equipment, data storage, and material handling systems. Others that saw big increases included semiconductors, appliances, and security equipment.
Warranted Product Sales
Along with the collection of the three warranty metrics detailed in Figures 1 through 3, we also compile data on product sales made by each warranty provider. The goal is to get a figure just for sales of warranted products, not total revenue, so all finance, service, consumables, mortgage, land, basic materials, and other non-warranted revenue sources are subtracted. For some service-intensive companies such as IBM, this changes the calculations significantly.
In 2015, the companies reporting warranty expenses together reported about $1.98 trillion in warranted product sales. That was up about 2.8% from the corresponding total in 2014. But of course, it's only about a tenth of the entire U.S. economy. That's because products such as food, apparel, medicine, fuel, commodities and chemicals generally don't have warranties, nor do financial services, medical services, education, transportation, utilities, or government spending. Also, we're not counting imports or domestic production by foreign companies, though we are including the warranty costs of exports made by U.S.-based companies.
Still, we're talking about roughly 10% of the U.S. economic output having warranties, and roughly one-and-a-half percent of those product sales ending up as warranty costs. And when you start with $18 trillion, that eventual total turns out to be roughly $25 to $26 billion per year, which is still a huge amount of money. Add another $41 billion to that for service contracts bought by consumers, and you have enough cash flow to support tens of thousands of warranty professionals.
Warranty Expense Rates
Over the course of the past 13 years, as the quarterly and annual sales totals have been collected, we have divided the corresponding expense totals for claims paid and accruals made by these sums, to calculate a pair of percentage rates: the claims rate and the accrual rate. These figures represent the percentage of revenue going towards paying warranty expenses. In Figure 4, there are 52 pairs of these expense rate measurements, from the beginning of 2003 until the end of 2015.
The good news is that the accrual rate of all the manufacturers reporting warranty expenses hit a new low of 1.2% in early 2015. The bad news is that it didn't stay that low for long. In fact, it's pretty clear that there is one trend from 2003 until 2012, and another trend in the past three years.
Figure 4
All U.S.-based Companies
Average Warranty Claims & Accrual Rates
(as a % of product sales, 2003-2015)
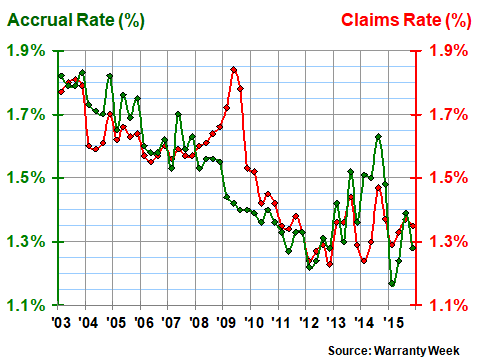
Except for the recessionary bump in the 2009 claims rate data, the direction of the expense rates was downward for ten years. Sure, there were little bumps along the way, but the overall trend was down, from around 1.8% to around 1.3%. But then in 2013, expense rates began to rise, and then began to fall, and then began to rise again. The trend has been no trend, as if manufacturers have stopped cutting warranty costs.
Is it because there's no more excess costs to be cut, perhaps because product reliability is at a new high or repair costs are at a new low? Or is it because the cost of warranty work on the latest generations of technology aren't as easy to keep under control as the older ones? We'll have to look into that in the weeks ahead, as we put each specific industry under magnification.
In Figures 5 through 7 we're providing some detail on the claims cost of each specific industry. Some of these totals will change as the rest of the late-filers report their financials to the SEC. Because this newsletter comes out about a week later in March than it did in past years, most of the year-end data is now in. But there are still a handful of stragglers.
Missing Companies
Late filers still to be heard from this year include Clean Diesel Technologies Inc.; Deer Valley Corp.; DJO Finance; Euramax Holdings Inc.; Harmonic Inc.; Itron Inc.; Lighting Science Group Corp.; Orbital ATK Inc.; PhotoMedex Inc.; and SORL Auto Parts Inc. As their warranty data becomes available, it will be added into the corresponding industry totals. But they're going to report millions, and we've already counted billions, so the overall totals will change only slightly.
And then there are all the companies that we won't be hearing from again, because of mergers, bankruptcy liquidations, going private, de-listings, or other financial changes they made in 2015. Besides FCA US LLC, the list of recent departures from the warranty-reporting population includes Adept Technology Inc.; Broadcom Corp.; CareFusion Corp.; Dot Hill Systems Corp.; Dresser-Rand Group Inc.; DriveTime Automotive Group Inc.; Planar Systems Inc.; PMFG Inc.; Ryland Group Inc.; Shea Homes; Tecumseh Products Co.; Thoratec Corp.; TRW Automotive Holdings Corp.; and Viasystems Group Inc.
We usually divide the spectrum of warranty-providing industries into three big sectors: vehicles, high-tech, and buildings. Basically, anything that doesn't have wheels or printed circuits goes into the building category. Admittedly, items such as sports equipment or jewelry don't fit well into that sector, but it is the least uncomfortable fit of the three available.
Traditionally, the vehicle sector, which includes everything from golf carts to commercial airliners, has comprised just under half the total claims and accruals, while the high-tech industries have accounted for slightly more than a third. But because warranty claims for vehicles are more numerous and their warranties are longer-lasting, the vehicle sector has accounted for about 60% of all reserves while the high-tech sector is closer to 25%. The building trades account for the balance.
The vehicle manufacturers saw claims fall by about $764 million in 2015, with most of that decline coming from the automotive OEMs. As can be seen in Figure 5 below, they almost got back to pre-recession levels in 2014, but claims fell back a bit last year.
Figure 5
Worldwide Warranty Claims Payments
of U.S.-based Vehicle Makers
(claims paid in US$ millions, 2003-2015)
Of course, there are numerous reasons for these declines. While in 2009 claims fell because there were less sales and fewer cars and trucks under warranty, they stayed low in the years since because the cost of warranty work declined even as sales rates recovered. In 2014, they rose because most manufacturers now include recall costs along with traditional warranty costs. And they fell last year because the overall cost of recalls declined even as sales rose.
Note that the overall claims total for the auto parts suppliers in 2015 was the lowest it's been since 2004. And the aerospace industry reversed the rise in claims cost seen during the previous two years, suggesting that companies such as Boeing are getting their new product technology under control.
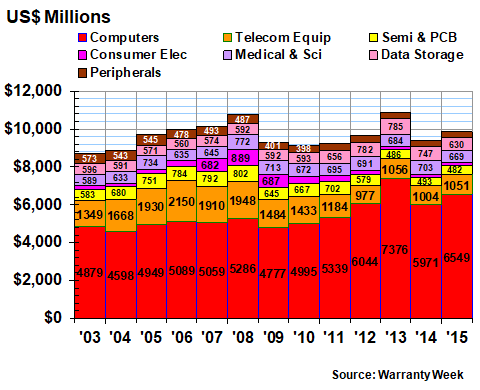
High-Tech Claims
In the high-tech industries, the big story was Apple, which surpassed General Motors to become the largest U.S.-based warranty provider in calendar 2015. Apple paid out almost $900 million more in 2015 than it did the year before, and that more than offset some of the declines experienced by the other high-tech companies.
In Figure 6, the overall gain since last year is $501 million, but that's a product of a big jump in claims for the computer OEMs (mostly Apple) and the peripherals manufacturers, and a big decline for the data storage companies (where most of the major players saw 15% to 20% declines in claims). The other four industries in this sector saw either minor gains or minor declines in their claims totals.
Figure 6
Worldwide Warranty Claims Payments
of U.S.-based High-Tech Manufacturers
(claims paid in US$ millions, 2003-2015)
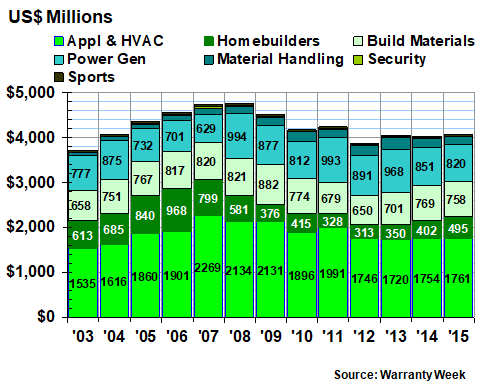
And then finally there are the building trades. The appliance and heating, ventilation & air conditioning (HVAC) manufacturers dominate, both in terms of the totals and the average expense rates. But because we're counting GE as a power generation equipment company (they could just as easily fit into either the appliance, aerospace, material handling, or medical equipment categories), that's the second-largest industry in this sector.
In Figure 7, the overall sector total has been close to $4 billion for three years in a row, though clearly there's a recovery under way in homebuilder claims and a decline in power generation claims. But don't blame the latter trend on GE. Its claims were actually up slightly in 2015. It has more to do with a decline in solar power sales, and the departure of major players such as Dresser-Rand (acquired by Siemens in June).
Figure 7
Worldwide Warranty Claims Payments
of U.S.-based Building Trade Companies
(claims paid in US$ millions, 2003-2015)
So there are the industry totals and averages for 2015, recalculated to remove Fiat Chrysler Automobiles, as if it had never reported its U.S.-only warranty expenses (it only did so recently because it issued some bonds, which have now been redeemed). We also recalculated the two new halves of the former Hewlett-Packard Co. to account for the improved revenue segmentation now available for warranted versus non-warranted product sales at HP Inc. and Hewlett Packard Enterprise, but that affected only the averages in Figure 4, not the totals in the other charts. And then there were some smaller companies that began segmenting their product versus service revenue in 2015 when they hadn't done so previously.
Industry Reports
In the weeks ahead, we're going to take deep dives into each industry, looking for more detail in regards to why the totals and averages are changing. But sometimes, the companies moving the averages haven't provided a reason. So in those cases we're stuck with knowing who, but not why.
Readers who can't wait for this months-long process to conclude should feel free to purchase individual company charts at http://www.warrantyweek.com/fasb/index.php for the nominal charge of $25 per company. Of course, all this data is also available for free from each company's Investor Relations web page. But for 13 years running, we've wasted all this time gathering all the data, so you don't have to.


