

Honda & Toyota Warranty Report:
Both companies are recovering from some bad years in terms of warranty costs: Honda in fiscal 2016 and Toyota in fiscal 2017. But according to the figures in their brand new annual reports for the just-finished year of fiscal 2018, both companies are now on the mend, with warranty costs that are still unusually elevated, but not as high as they were a year or two ago.
During this particular week of this particular summer, the only Americans who are at work are only pretending to work. Yesterday was our Fourth of July Independence Day, landing smack in the middle of the week, making a long weekend a difficult ambition. So anyone in the U.S. who has to work today is silently protesting the tyranny of the calendar by only pretending to work.
However, about 22% of our readership resides in other countries besides the U.S. For them this year, the Fourth of July was just another Wednesday. And as the British emigrant Glen Griffiths once remarked the last time the Fourth fell on a Wednesday, "if we took a holiday for every colony we lost, we'd never get any work done."
Besides, for our readers in places such as Australia and South Africa, July is a cold month with little to celebrate and no big holidays (though Nelson Mandela's 100th anniversary is coming up soon). And so, it is for all of those warranty professionals who don't get an orphaned holiday in the middle of the week and who therefore don't have a good excuse for not working, that we turn our outlook abroad for this week's newsletter.
Japanese Annual Reports
It just so happens that both Toyota Motor Corp. and Honda Motor Company Ltd. end their fiscal years in March and publish their annual reports in late June. So on this occasion we will turn our total attention over to them, as we do for GM and Ford in the spring and Apple in the fall, when they publish their respective annual reports.
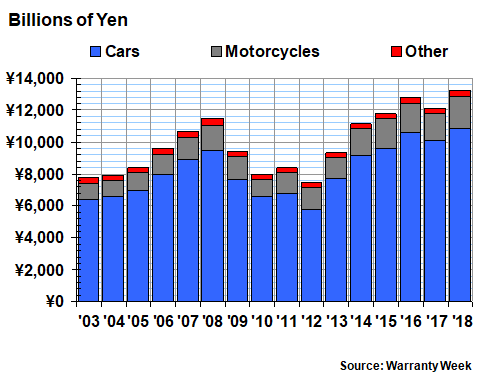
But before we begin to dig into the latest warranty metrics reported by these two titans of Japanese manufacturing, first we need to do a little explaining about the Honda product line. Besides passenger cars, the company also makes motorcycles, generators, ATVs, scooters, lawn mowers, snow blowers, boat motors, and even some airplanes. However, passenger cars and motorcycles have accounted for 96% to 97% of the company's revenue over the past fifteen years, as the following chart details.
Figure 1
Honda Motor Company Ltd.
Source of Product Revenue
(in billions of yen, 2003-2018)
The main problem with trying to figure out the warranty accruals made by Honda per vehicle sold is the vast difference in selling price between a car and a motorcycle. Last year, the cars sold for an average price of US$27,000 while the motorcycles brought in an average of $1,500 each. If each product had the same accrual rate of 1.7%, the car's accrual would be $459 while the motorcycle's would be only $25 per unit sold.
Warranty Accrual Per Car
What we're going to do is avoid this problem by looking at just the cars. Rather than calculating the accrual per unit by taking the company's total accruals and dividing it by units sold, we're going to take the average selling price of a Honda passenger car and multiply it by the entire company's accrual rate.
Below is a chart of the average selling price and number of units sold per year reported by Honda for its passenger car product line. The revenue figures, as detailed in Figure 1, have been converted into U.S. dollars in this instance.
Figure 2
Honda Motor Company Ltd.
Average Selling Price & Units Sold
(in US$ & millions, 2003-2018)

Notice that the company has sold three to four million cars worldwide per year since fiscal 2003 (the company's fiscal years end on March 31). And the average selling price has drifted upwards from around $20,000 to around $27,000 over that period. Curiously, the company reports some of its lowest average selling prices in its home market of Japan, while some of the highest prices prevail elsewhere in Asia.
Next we collected several warranty metrics from the annual reports of both Honda and Toyota. We gathered annual figures for claims paid, accruals made, and reserves held, all denominated in Japanese yen. And we found figures for warranted product sales (no service or finance revenue included).
Claims & Accrual Totals
In Figure 3, we are detailing the claims and accrual totals reported each year by Honda. Notice the tremendous spike in fiscal year 2016 accruals, which were more than twice as large as any other year's. The company previously explained that this was primarily due to the expense of a massive recall of defective air bags (see Warranty Week, July 7, 2016 for more).
Figure 3
Honda Motor Company Ltd.
Claims Paid & Accruals Made
(in billions of yen, 2003-2018)
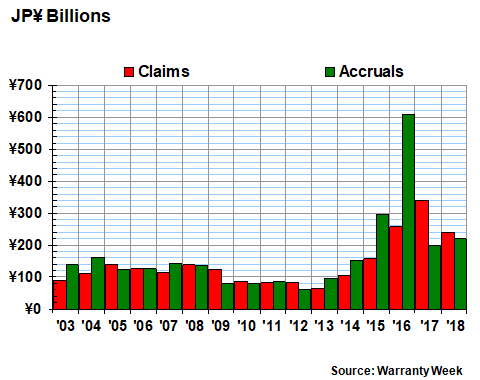
Notice that the company's claims also escalated from fiscal 2014 to 2017, before falling back in the most recent fiscal year. For more than a decade, Honda reported some of the lowest warranty expense rates in the world. But then from fiscal 2015 to 2017 things went awry. Now they're beginning to get back to normal.
Since the company reports in yen, it has felt the pain of these expense increases in yen, so we left them denominated in yen so as not to deform them by converting them into U.S. dollars. Over the past 15 years, the value of one dollar has swung from 82 to 133 yen, so that in and of itself could exaggerate the annual changes, if all the charts were in dollars.
Percentages of Revenue
In Figure 4, we've eliminated the currencies altogether, recasting the data in Figure 3 as a percentage of the revenue detailed in Figure 1. This results in a pair of percentages, the claims rate and the accrual rate. As is once again plain to see, the fiscal years 2015 to 2017 were somewhat painful for Honda, with its accrual rate peaking at 4.8% in fiscal 2016 and its claims rate peaking at 2.8% a year later.
Figure 4
Honda Motor Company Ltd.
Average Claims & Accrual Rates
(as a % of product sales, 2003-2017)
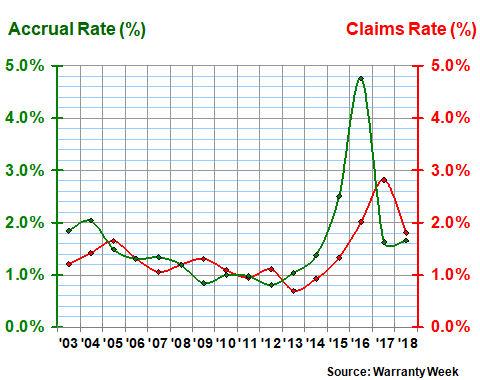
In the fiscal year that ended this past March, we're happy to note that Honda's claims and accrual rates are once again back below two percent, with claims at 1.8% and accruals at 1.7%. But as good as that news is, note that even these latest numbers are higher than most of the data in the 2003-2014 baseline.
Toyota's Warranty Expenses
Next we'll take a look at Toyota's warranty expenses over the past fifteen years. Toyota also ends its fiscal year on March 31, and so its latest annual report for fiscal year 2018 was also just recently published.
In the June 30, 2011 newsletter, we reported on the spike in Toyota's warranty costs related to its recall of floor mats and accelerator pedals. At that time, we noted how the recalls were driving up warranty costs in fiscal years 2009 to 2011.
However, in Figure 5, we note that there's a new spike in fiscal 2017. But actually, while the height of the spike in accruals was in fiscal 2017, warranty accruals have been higher for the past four fiscal years than they were in fiscal 2011.
Figure 5
Toyota Motor Corp.
Claims Paid & Accruals Made
(in billions of yen, 2003-2018)
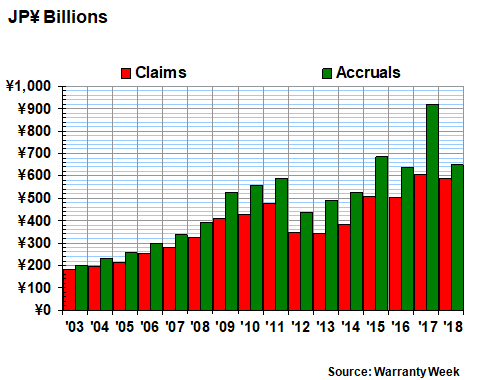
In other words, while the unintended acceleration problems of 2009-2011 got all the publicity, the impact of Toyota's 2017 warranty expense problems were even worse. This is borne out by looking at not just the size of the expense in yen, but also as a percentage of product revenue. This is what we've done in Figure 6 below. And in both charts, the peak of 2017 is higher than the peak of 2011.
Figure 6
Toyota Motor Corp.
Average Claims & Accrual Rates
(as a % of product sales, 2003-2018)
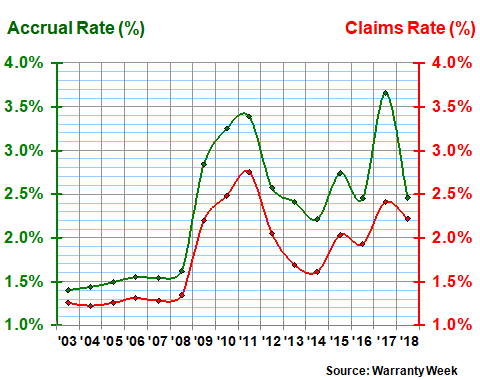
Therefore, when it comes to warranty expenses, Honda has a bad fiscal 2016. Toyota had a bad fiscal 2017. Accruals consumed nearly 3.7% of Toyota's revenue -- nearly 0.3% higher than the percentage in 2011. And while the company's claims rate did not breach the heights of 2011 in this latest crisis, it remains far above the baseline. This is entirely the fault of recalls.
In fiscal 2011, Toyota began including two tables in its annual reports. One enumerated the expenses for warranty and recalls together (quality assurances). The other enumerated the expenses for recalls only. By subtracting one from the other, we can report that 86% of Toyota's combined warranty and recall accruals in fiscal 2017 came from recalls alone. In fiscal 2018, 78% of claims paid were from recalls, and only 22% were from warranty.
In other words, were it not for the recalls of 2009-2011 and 2017-2018, Toyota's warranty expenses would likely be more like 2003-2008. And in some respects, the financial impact of 2017-2018 is worse than 2009-2011.
Accruals Per Unit Sold
There's yet another way of measuring the impact of recalls on warranty expenses. Since we've collected data on the amount of accruals made by both Honda and Toyota over the past 15 years (as detailed in Figures 3 and 5), and since we also have data on the number of cars each sold per year, we can calculate the average amount of accruals made per vehicle since 2003.
It can't be done with claims, because the timing of the warranty work (and especially the safety recalls) will rarely coincide with the year of manufacture or sale. There's always a lag time between when the vehicle enters service and when it needs warranty work, so there's no real correspondence between claims data and sales data (at least not in terms of the data available to external observers).
Internally, companies can easily measure the age of a product at the time of failure, using so-called loss triangles to spot patterns in the data. However, that data is never shared with customers, investors, nor the financial press. So all the data on the claims cost of a given make or model year remains secret.
Also, companies never release data on the number of cars whose warranties expired prematurely because of high mileage, wrecks, or sales (if the warranties are non-transferable). Therefore, we can never know with precision how many vehicles are under warranty at any given point in time, especially for those model years that are close to the scheduled end of their warranties.
However, according to the best practices of the warranty industry, a company is supposed to calculate the expected average cost of a product's warranty at the time a product is sold, and is supposed to set aside that amount as a warranty accrual after each sale is made. So if a company calculates the average cost of warranty to be $500 per car, and it sells a million cars, it should accrue $500 million.
And then, as external observers, we can easily calculate in reverse that if a company sells a million cars and accrues $500 million per year, its accrual averaged $500 per vehicle over that time period. There should be nearly a one-to-one correspondence between the number of cars, the number of warranties, and the average accrual per car or per warranty.
Calculating Accruals Per Unit Sold
In Figure 7, we've performed two calculations per company. First, we calculated the average accrual per vehicle, in Japanese yen. Then we applied the prevailing exchange rate at the time, to calculate the accrual per vehicle in U.S. dollars.
Notice how clearly the 2009-2011 rise for Toyota appears, and how the 2017 rise doesn't quite reach as high. On the one hand, this is the case because while Toyota sold 7.3 million units in 2011, it sold nearly 9 million units in 2017. But on the other hand, while the dollar was worth 83 yen in 2011, it was worth 111 yen in fiscal 2017. If the chart was denominated in yen only, the figure for 2017 would be much higher than it was in 2011.
Figure 7
Honda & Toyota
Accruals per Vehicle Sold
(in US dollars, 2003-2018)
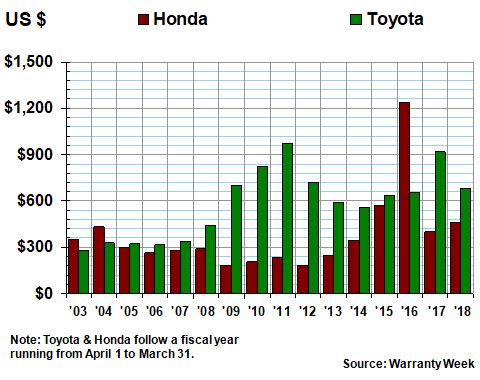
Also notice how the figure for Honda in fiscal 2016 set a new record of $1,237 per vehicle, more than five times as the company accrued per vehicle back in 2011. Once again, the weakening of the yen-dollar exchange rate was a major factor, with relatively little change in the number of units sold (see Figure 2).
In other words, since eventually we're going to convert all the accruals-per-vehicle calculations into U.S. dollars, so we can compare Asia to Europe to Tesla to Tata, the rising value of the U.S. dollar in and of itself distorts the changes.
Warranty Reserves
Therefore, let's switch back to yen for our final warranty metric. Those who need to think in dollars can take a shortcut: chop off two zeros and call them billions of dollars. In other words, Toyota's warranty reserve fund has most recently topped out around $16 or $17 billion (the actual figure on March 31, given prevailing exchange rates at the time, was the equivalent of US$16.03 billion).
Figure 8
Honda & Toyota
Warranty Reserves Held
(in billions of yen, 2003-2018)
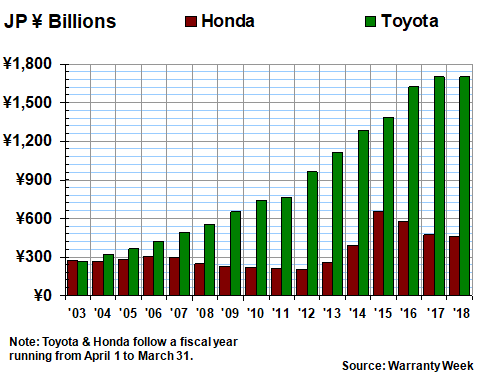
To put that figure into perspective, General Motors Co. ended 2017 with US$8.33 billion in its warranty reserve fund. Volkswagen AG, which has its own warranty recall crisis to deal with, had 27.9 billion euro, or the equivalent of US$31.5 billion, in its warranty reserve fund at the end of calendar 2017. So, depending on how you look at it, at least in terms of warranty reserves, Toyota is like two GMs, and one VW is like two Toyotas.


