

Warranty Accruals per Vehicle Sold:
Once again, Tesla comes out with the most expensive warranty while Hyundai is the least costly. But the warranty cost rankings of the passenger car and light truck manufacturers in between have shifted somewhat, with the Asian carmakers seeing their accrual rates per vehicle rise and the North American manufacturers seeing their warranty costs drop.
With the right metrics in hand, it is possible to not only calculate what percentage of sales revenue goes towards warranty expenses, but also how much money is set aside per vehicle as it is sold.
The annual reports of most of the world's top passenger car and light truck manufacturers contain three essential metrics: the number of vehicles sold per year, the amount of warranty accruals made each year, and the total revenue raised through those sales. Using those three metrics, we have calculated two additional metrics: the warranty accrual rate as a percentage of sales, and the amount of accruals made per vehicle sold.
Most of the world's top auto manufacturers began reporting their warranty metrics in 2003, except for Hyundai Motor Co., which did not begin until 2004. All of them report their metrics at least once a year, with most following the calendar year, except Toyota Motor Corp., Honda Motor Co. Ltd., and Tata Motors Ltd., which follow a fiscal year that ends on March 31.
Toyota and Honda report their sales revenue in Japanese yen. Tata reports in Indian rupees. Hyundai reports in Korean won. Daimler AG, Volkswagen AG, BMW AG, and Fiat Chrysler Automobiles NV report in euro. General Motors Co., Ford Motor Co., and Tesla Inc. report in U.S. dollars.
Since the accrual rates are in percentages, the currencies drop out of the calculations, so foreign exchange rates are not a complication. However, when it comes to our calculations of warranty accruals per vehicle, the currencies involved are a major complication. For instance, VW, BMW, Honda, Toyota, Fiat, and Hyundai must deal in dollars when their U.S. factories turn out American-made cars. Tata has to factor in the fluctuations of the British pound when manufacturing Jaguar and Land Rover vehicles. Ford and GM deal in euro when their European factories make (or made, in the case of GM) vehicles in Germany, Spain, and Poland. And all of them have to factor in the local labor rates and taxes in the markets where they make the sales and do the warranty work.
Fortunately, the warranty accrual process makes our calculations a bit less complicated in one respect. Unlike warranty claims, which are paid when a vehicle is repaired, warranty accruals are made when a vehicle is first sold, so there's no lag time between the two. When sales rise, accruals rise in proportion, unless the company predicts a material change in reliability, quality, or average repair cost. So if accrual rates aren't flat and constant, there's a warranty-related reason for the change.
European Manufacturers
In Figure 1, for instance, the accrual rate for VW is fairly constant at roughly 5.4% of revenue for 12 years, from 2003 until 2014. But then in 2015 it spikes to 10.5%, and has remained elevated ever since. That of course is a direct result of the diesel engine emissions scandal, and the cost of the recalls, repairs, and repurchases that resulted. During the past three years, VW has accrued 46.4 billion euro, making it by far the world's largest warranty provider.
Figure 1
European Auto Manufacturers
Warranty Accrual Rates
(percentage of sales, 2003-2017)
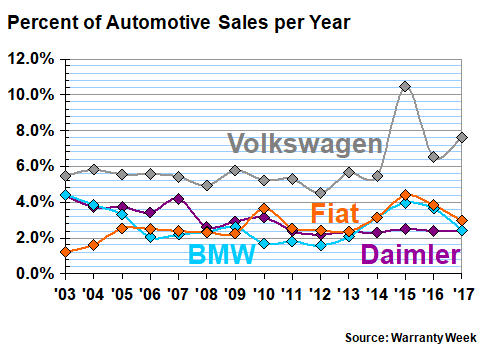
In contrast, BMW, FCA and Daimler are each now setting aside between 2% and 3% of their automotive revenue to pay for warranty work. At Daimler, accrual rates have been fairly flat and constant at 2.4% since 2011. But at BMW and Fiat, the reductions in warranty costs have been massive and noticeable in recent years. Both were close to 4% in 2015, a level that Daimler hasn't seen since it before it sold off its interest in Chrysler.
With these four companies, it is possible to compare warranty expenses in a different way. By taking their annual accrual totals, and dividing it by their annual unit sales totals, we can calculate the average amount of euro each company sets aside every time they sell a vehicle. It's not a perfect metric (Daimler and VW have their trucks; BMW also makes motorcycles, etc.), but it is a simple and honest way to measure the ebb and flow of warranty expenses. And it's in euro, so again there's one less complication to the comparisons.
Figure 2
European Auto Manufacturers
Accruals per Vehicle Sold
(in euro, 2003-2017)
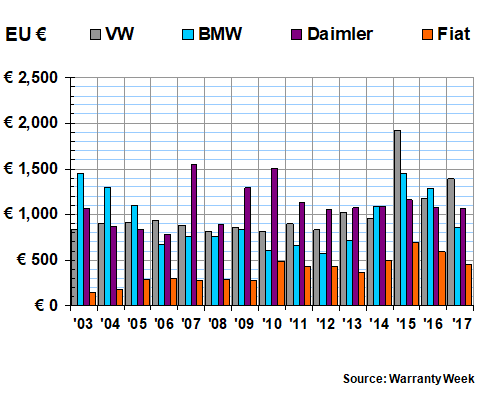
Once again, we see how expensive warranties became for VW in 2015. However, there are other points at which both Daimler and BMW were accruing 1,500 euro or more per vehicle sold. For them, it's not as painful, however, because the average selling price of their luxury vehicles is much higher, and therefore the accrual rates as a percentage of revenue are much lower (see Figure 1). But even in the good old days, VW had the highest accrual rates in Europe, if not the world.
Asian Manufacturers
Eventually, however, everybody takes their turn in the warranty doghouse. While 2015 was a painful year for VW, Honda had its airbag crisis in fiscal 2016, and Toyota had its floor mat problems beginning in fiscal 2009. Tata, meanwhile, saw its warranty costs soar in fiscal 2009 after it completed its acquisition of Jaguar Land Rover.
Figure 3
Asian Auto Manufacturers
Warranty Accrual Rates
(percentage of sales, fiscal 2003-2018)
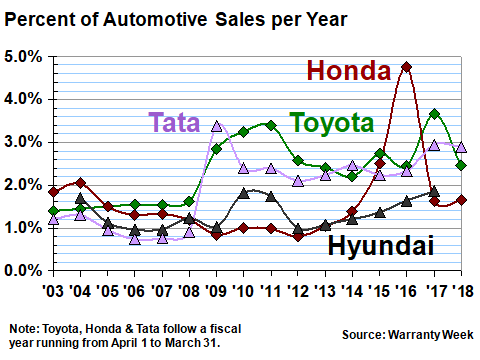
In both Figures 3 and 4, there's an additional complicating factor for the data. Toyota, Honda, and Tata follow fiscal years that end on March 31, while Hyundai follows the calendar year. Therefore, there's no data yet for Hyundai in 2018, while for the others the fiscal 2018 data represents three months of calendar 2018 and nine months of 2017. So strictly speaking, they're not comparable.
In addition, when it came time to compare their accrual rates per vehicle sold, we had the additional complicating factor of having to deal with three different currencies. In the July 5 newsletter, when we examined the accrual rates of Toyota and Honda in detail, we stuck to yen wherever possible. But in this case we have to also factor in the Indian rupee and the Korean won.
And so, what we've done in Figure 4 is to default to U.S. dollars. Since 2003, the value of one U.S. dollar has swung from 82 to 133 yen, so this is much more than merely a rounding error. Readers who would prefer to see this data presented in three different charts using only the native currencies of each company should send a message to the editor.
Figure 4
Asian Auto Manufacturers
Accruals per Vehicle Sold
(in U.S. dollars, fiscal 2003-2018)
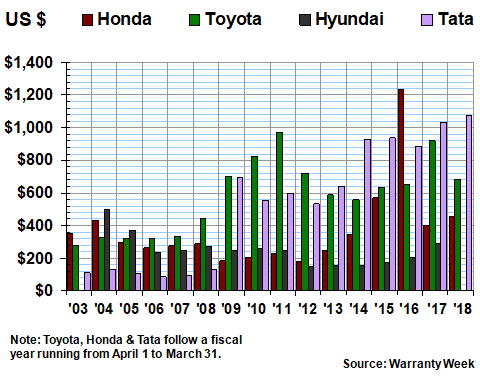
Figure 4 tells the same story as Figure 3, with Toyota's warranty costs spiking in 2009, and Honda's reaching new heights in 2016. But it also tells a story that perhaps Tata would rather left untold: Jaguar and Land Rover warranties sure are expensive! Except for Honda's miserable year of 2016, Tata has accrued the most money per vehicle sold for the past six years. And its warranty costs per vehicle have exceeded US$1,000 for the past two years -- roughly 10 times what it cost in the pre-acquisition days of 2003-2008.
There's one additional complication with the Tata calculations. While most of the automakers denominate their revenues and expenses in millions and billions, Tata uses the crore, which in the Indian numbering system is equivalent to 10 million. For unit sales, Tata uses the lakh, equal to 100,000, and groups its digits in both threes and twos. Therefore, 10,00,000 (ten lakhs) is equal to one million units.
For the latest fiscal year, Tata reported 8,533.88 crore rupees in warranty accruals, 295,409.34 crore rupees in revenue from operations, and total unit sales of 12,21,124 (twelve lakhs). For fiscal 2018, we used a currency exchange ratio of 65 rupees to the dollar and calculated accrual rates of 2.9% and $1,074 per vehicle. Warranty Week has a significant number of readers in India, so perhaps someone can double-check our math?
North American Manufacturers
We detailed the warranty expenses of GM, Ford, and Tesla in the March 8 newsletter, so we won't repeat it again here. In Figure 5 below, we're sketching the annual accrual rates of all three companies for the past 15 years, or in the case of Tesla, for the past nine years. And, in keeping with the theme that everybody eventually takes their turn in the warranty doghouse, note the 2014 spike in GM's accrual rate as the ignition switch recalls became a major expense.
Figure 5
North American Auto Manufacturers
Warranty Accrual Rates
(percentage of sales, 2003-2017)
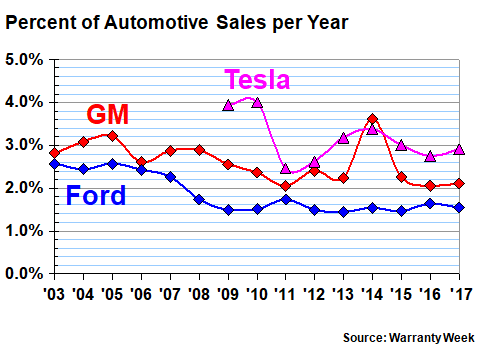
Ford, as is clear from the chart above, has kept its warranty accrual rate very close to 1.6% since 2008. However, it has maintained that relatively low rate by making what it calls "Changes in accrual related to pre-existing warranties," to the tune of $1.42 billion last year and $1.36 billion in 2016.
These accruals are not being made at the time of sale; instead they're corrections for past under-accruals. If they were added to the totals for "normal" accruals, Ford's warranty expenses would be significantly higher. However, as with claims payments, an external observer cannot readily ascertain which vehicles or which model years required the additional accruals, so they don't factor into the calculations in this week's newsletter.
Correcting Warranty Cost Predictions
In the opposite case, when a manufacturer discovers a past over-accrual and removes funds from the warranty reserve fund through a change in estimate, we again cannot readily subtract those amounts from the current-year accruals, because we don't know which year's models turned out to have warranty costs below projections made at the time of sale. But we can still note that these accounting corrections were necessary.
For instance, last year GM removed $495 million from its warranty reserve fund last year, partially offsetting the $2.8 billion in "normal" accruals it made during the same period. In 2016, it had to add an extra $625 million to its warranty reserves to correct past under-accruals. Other manufacturers have done the same. For instance, VW removed 1.88 billion euro from its reserves last year to correct for past over-accruals. Daimler removed 217 million euro, and BMW removed 70 million euro. All the other OEMs made smaller adjustments either up or down last year.
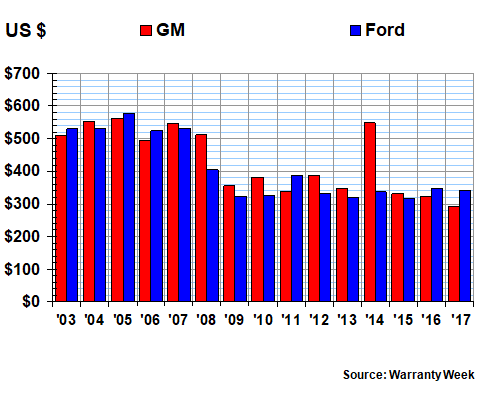
In Figure 6, however, we're taking the amount of "normal" accruals by GM and Ford and dividing them each by the number of vehicles sold, to calculate the accruals made per sale. Again, the 2014 anomaly for GM is very noticeable, with its per-vehicle accruals spiking to nearly $550 that year. However, what also is clear is that while a decade ago these manufacturers used to set aside around $500 per vehicle sold, they now set aside only $300 or so. And a 40% decline in 10 years is something worth noting.
Figure 6
North American Auto Manufacturers
Accruals per Vehicle Sold
(in U.S. dollars, 2003-2017)
On the same scale as is used in Figure 6, it's difficult to make this 40% decline in warranty costs visible if we include Tesla. The electric car company has the highest warranty cost per vehicle in the worldwide passenger car industry, although as a percent of revenue it's not even as high as VW (again, because the price per vehicle is also much higher). Still, we have to find a way to include them.
In addition, for the five years between its bankruptcy in 2009 and 2014, Fiat Chrysler Automobiles US LLC, the official name of what used to be called Chrysler LLC, issued bonds that required it to file separate financial statements with the U.S. Securities and Exchange Commission. And since those financial reports also included warranty expense data, we're including it here in Figure 7. For the past three years, the only Chrysler data has been in the financial reports of its current parent company, Fiat Chrysler Automobiles NV, which we detailed in Figures 1 and 2.
Figure 7
North American Auto Manufacturers
Accruals per Vehicle Sold
(in U.S. dollars, 2013-2017)
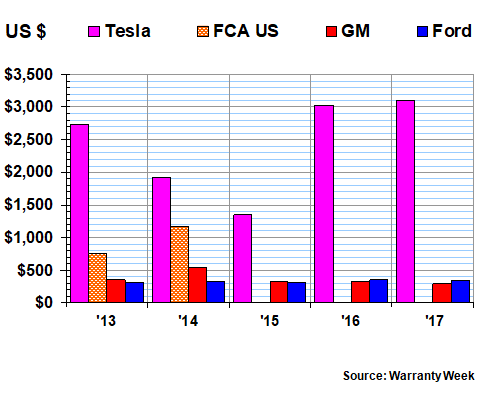
What the data in Figure 7 shows is that Chrysler's warranty expenses were higher than either Ford's or GM's, and Tesla's was higher than any of them. Ironically, as bad as the Tesla data looks, its claims rate has been much lower, averaging only 1.5% of revenue for the past nine years. In other words, the company is setting aside funds it's not spending, with the balance in its reserve fund growing steadily as a result.
But again, it's difficult for an external observer to correlate the claims data with any particular model year. And in Tesla's case, there may still be huge battery replacement costs ahead, as its vehicles get closer to the date their warranties expire. So it may yet make rational sense for it to have $400 million in its warranty reserves as of December 2017, and to add $249 million in accruals to that fund last year, while spending only $123 million on claims. Or it may not, in which case the eventual change in estimate is going to slash warranty costs going forward.
Worldwide Warranty Costs
In a future newsletter, we are going to make some of our own estimates for auto manufacturers that do not detail their warranty expenses in their annual reports. Between them, for instance, SAIC, Nissan, Renault, Suzuki, and Dongfeng sold more than 20 million vehicles, but we have no warranty data for them, or for Mazda, Mitsubishi, Subaru, Isuzu, or several others.
What we do know is that the 11 auto manufacturers whose warranty expenses are detailed in this week's newsletter sold 56 million vehicles last year, which is well over half the world's total output. And in Figure 8, after converting everything into U.S. dollars, we are ranking these 11 companies from most to least expensive warranties per vehicle.
Figure 8
Worldwide Auto Manufacturers
Accruals per Vehicle Sold
(in U.S. dollars, 2016-2017)
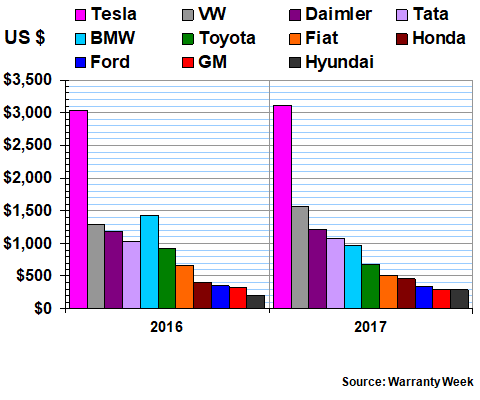
As was mentioned, Tesla is at the high end of the scale, with a per-vehicle accrual rate of nearly $3,105 last year. Hyundai is at the low end of the scale, with a per-vehicle accrual rate of only $291 -- one tenth of Tesla's accrual rate per vehicle. But what's remarkable is that GM is only one dollar higher than the warranty cost leader, and Ford is in third place at $342 per vehicle sold.
VW and Daimler are above the $1,000 per vehicle threshold, and BMW is very near it, which on the one hand illustrates how expensive the diesel emissions scandal has been for VW and on the other hand illustrates how expensive the warranties on luxury German vehicles really can be. And thanks to the added expense of Jaguar Land Rover, Tata is also now on the over-$1,000 list.
In the middle of the pack are Toyota, Fiat, and Honda, which is astounding given that all three used to be closer to the bottom of the chart when we first began calculating these per-vehicle warranty costs more than a decade ago. But perhaps as the costs of recalls and unexpected spikes in warranty costs recede, and if the U.S. dollar exchange rate ever returns to historical norms, they'll once again challenge Ford, GM, and Hyundai for the worldwide lead.


