Apple's Warranties & Service Contracts:
While AppleCare is still the biggest extended warranty program in the world, it hasn't grown much in years. And while Apple is spending more on product warranties than either GM or Ford, that's not growing either. No wonder investors are spooked by the company's future prospects.
The stock of Apple Inc. has taken a beating this week as investors digest all the financial figures contained in the company's annual report for the fiscal year ended September 29, 2018. While we'll leave it to others to figure out whether or when iPhone sales become a replacement market, we note that all of the company's product protection metrics suggest that the peak came a few years ago.
That isn't as scary as it sounds. In Europe and North America, automobile sales have been in replacement mode for years. So have most appliances, as well as televisions, cameras, and personal computers. It simply means that almost everyone who wants one has one, and won't need another until it's time to replace an old one.
This in turn has an effect on the importance of product warranties as well as on sales of extended warranties. For instance, factory warranties are touted in virtually every automobile advertisement, and are offered as an indicator of product quality. Extended warranties are very important when a product is invented, as with early laptops and flat screen TVs. But then, as the products begin to be taken for granted, their protection plans become less important too.
Is this where we are with the iPhone? Although there are still some flip-phone holdouts, and others with no mobile phones at all, smartphone sales show signs of topping out. It's one of the main reasons Apple shares have had such a tough week: investors fear the lack of growth. But as we will show in the following nine charts, the lack of growth has been evident for several years in Apple's product warranty and extended warranty metrics.
Warranty Claims
Let's begin with product warranty claims. In Figure 1, we're charting the total amount of claims paid per quarter from the first quarter of 2003 to the third quarter of 2018. Since Apple's fiscal year ended on September 29, we're mapping the company's fourth fiscal quarter to the third calendar quarter. In future reports, the data from Apple's first quarter of fiscal 2019 (the months of October, November, and December 2018) will map to the fourth calendar quarter of 2018, and so on.
Figure 1
Apple's Product Warranties
Claims Paid per Quarter, 2003 to 2018
(in Millions of U.S. Dollars)
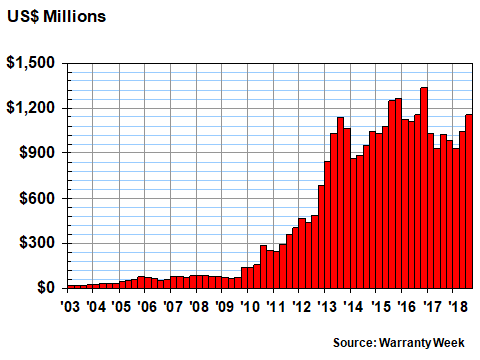
One can see from the chart that Apple's largest quarterly claims total came during the quarter containing the months of October to December 2016, when the company spent $1.337 billion on claims. However, the most recent quarter, covering the months of July to September 2018, produced the highest quarterly claims cost since then.
In the fiscal year just completed, Apple spent $4.115 billion on claims, down about 4.8% from fiscal 2017 levels. It was the second fiscal year in a row that saw claims decline, after they peaked at $4.663 billion in fiscal 2016. But it still means that Apple remains the largest product warranty provider based in the U.S. (ahead of both GM and Ford).
Warranty Accruals
In Figure 2, we're looking at warranty accruals, which is the amount of funds that Apple sets aside as products are sold, in order to finance all the expected warranty claims it will pay in the year ahead. As such, it's more of a prediction than an expense, and could turn out to have been too high or too low, depending on the actual amount of claims paid.
The last few years have seen a pattern where Apple seems to make up for recent under-accruals by making an extra-large accrual in the fourth calendar quarter of each year, which translates into the first quarter of the company's fiscal year. If that pattern holds once again this year, then right now we'd be halfway through the quarter in which Apple will turn up the accruals. However, note that the extra-large accrual may have come early this year, in the quarter covering the months of July to September 2018, Apple's fourth fiscal quarter.
Figure 2
Apple's Product Warranties
Accruals Made per Quarter, 2003 to 2018
(in Millions of U.S. Dollars)
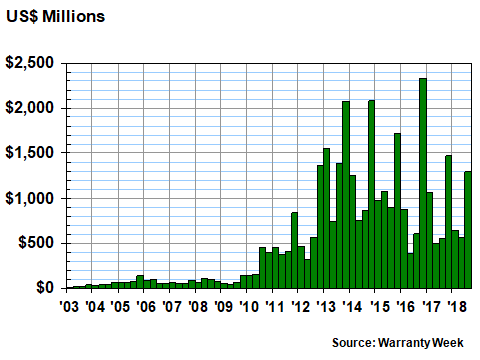
In the most recent quarter, Apple accrued $1.295 billion, which is at the low end of the recent spikes. If the pattern holds true, we might expect another $2+ billion accrual in the current quarter, as happened at the end of calendar 2013, 2014, and 2016.
In fiscal 2018, Apple accrued a total of $3.973 billion, down around 11% from the fiscal 2017 total. Last year's total is far below the $5 billion peaks seen in fiscal 2013, 2014 and 2015, however.
Warranty Reserves
The closing balance in Apple's warranty reserve fund is also down from its peak, as can be seen in Figure 3 below. That peak came at the end of calendar 2015, when Apple had $5.236 billion in its warranty reserve fund.
Figure 3
Apple's Product Warranties
Reserves Held per Quarter, 2003 to 2018
(in Millions of U.S. Dollars)
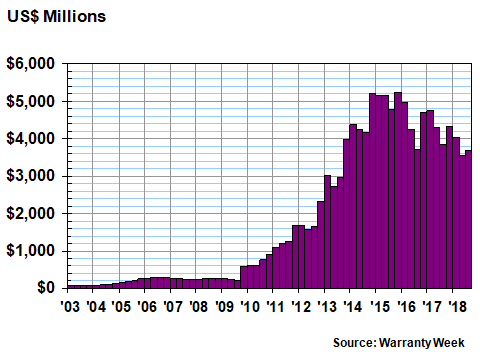
In September 2018, at the end of its most recent fiscal year, that balance stood at $3.692 billion. And that was, except for the $3.553 billion balance reported in June 2018, the lowest warranty reserve fund balance that Apple has reported in the last five fiscal years.
Extended Warranty Metrics
Until this point in the story, all of Apple's warranty metrics have been taken straight out of the company's financial statements. However, in order to make some estimates about the size of its AppleCare extended warranty program, we are going to have to add some guesswork into the mix.
When a company sells an extended warranty policy for which it retains some of the risk and duty to perform, it has to initially report the premium paid as deferred revenue. And then, gradually, over the life of the service contract, it recognizes that revenue.
For instance, if Apple sells a two-year AppleCare plan for $129, it would initially defer the entire amount. And then, after one year, it would recognize $64.50 in revenue, and after the end of the second year, it would recognize the remaining $64.50.
When Apple sells a gift card, the amount on the card is also initially reported as deferred revenue. And then, when the card is redeemed, the revenue is finally recognized. Unlike an extended warranty, however, a gift card can be redeemed at any time, or never. Because of this uncertainty, gift cards are usually classified as current liabilities.
With a two-year extended warranty, half the deferred revenue would initially be classified as a current liability, and half the deferred revenue would be classified as a long-term or non-current liability. After the end of a year, the first half would have been recognized, and the second half would move from a long-term to a current liability.
The point of all this is to say that Apple reports its gift card and AppleCare revenue together. It does not separate the two. It does, however, report its current and non-current deferred revenue separately. But there's no gift cards in the non-current portion. And at any given point in time, since most of the contracts are for two years, half the AppleCare premiums, more or less, are each in the current and non-current piles.
This allows us to figure out and estimate how much of Apple's reported deferred revenue balance comes from AppleCare, and how much comes from gift cards. And as can be seen in Figure 4, we estimate that of the $10.34 billion that Apple reported as deferred revenue in September 2018, about $5.6 billion, or 54%, came from AppleCare premiums paid.
Figure 4
Apple's Protection Plans:
Service Contracts vs. Gift Cards Sales
in Fiscal Years 2003 to 2018
(in Millions of U.S. Dollars)
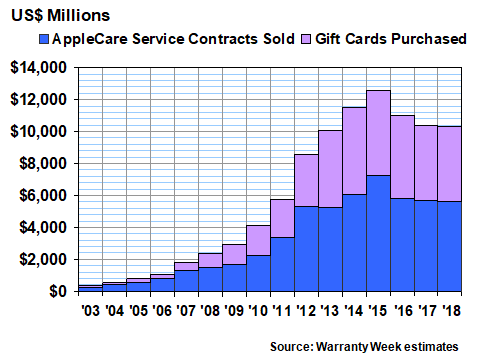
That amount of deferred revenue estimated to have come from extended warranty sales has remained at or near that level for five of the past seven fiscal years. In fiscal 2015, the amount of AppleCare deferred revenue surged to near $7.25 billion. And in fiscal 2014, it topped $6 billion. But in the other five fiscal years, it has remained in a tight range of $5.25 to $5.9 billion, according to our estimates.
We note that this is a worldwide estimate, and we also note that this means the AppleCare extended warranty program remains the largest in the world, bigger than any other manufacturer's, retailers, or insurance company's program. Apple may not be the world's largest product warranty provider (that would be Volkswagen), but it remains the world's largest extended warranty provider.
Protection Plan Comparison
In Figure 5, we're breaking more accounting rules, trying to chart the cash flows of Apple's product warranty program and its extended warranty program. The red and green lines in the chart below are straightforward comparisons between the quarterly data in Figures 1 and 2 and the corresponding product revenue totals reported by Apple. As such, the red and green lines represent the percentage of product revenue spent on claims and accruals, respectively.
The blue line takes the AppleCare amounts estimated in Figure 4 and compares them to the corresponding annual product revenue amounts reported by Apple. It looks less choppy because there are far fewer measurements over the course of the last 16 fiscal years. But it also reveals that AppleCare revenue hasn't kept up with product revenue growth, falling in six out of the last eight fiscal years.
Figure 5
Apple's Protection Plans:
Claims Paid, Accruals Made & AppleCare Sales
as a Percentage of Product Revenue, 2003 to 2018
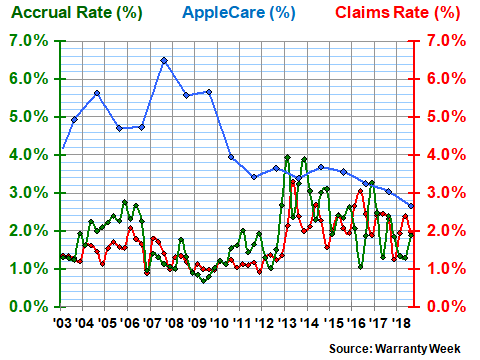
As of September 2018, Apple's claims rate was just under two percent. Its accrual rate was just under 1.9%. And we estimate that the amount of deferred AppleCare revenue was equal to about 2.7% of product revenue. And that's the lowest it's ever been, according to our estimates.
Comparing Accruals to Premiums
As long as we're breaking accounting rules, let's compare Apple's product warranty accruals to its extended warranty deferred revenue totals. In Figure 6, the blue is extended warranty and the green is product warranty. The chart displays the relative shares of each, with both always adding up to 100%.
As can be seen in the chart below, over the past 16 years product warranty has accounted for anywhere from 15% to 49% of the total, while extended warranty has been in the majority every time.
Figure 6
Apple's Protection Plans:
AppleCare vs. Product Warranties
in Fiscal Years 2003 to 2018
(as a percentage of total)
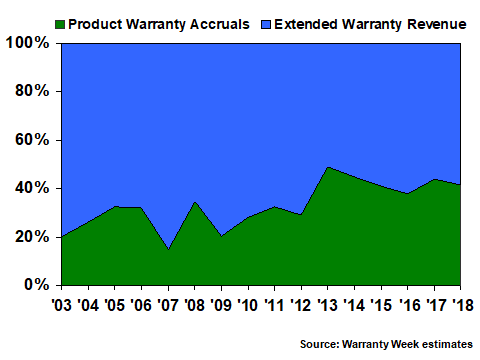
Over the long term, the ratio has been close to two-to-one. In fiscal 2018, product warranty accounted for 42% of the total, while extended warranty accounted for 58%. The ratio between the programs was 1.4-to-1 last year -- lower than the long-term average but at the high end of the range it's been in for the past six fiscal years.
U.S. vs. International
The AppleCare and AppleCare+ protection plans are not available in every country around the world. Therefore, Mac and iPhone buyers in certain countries will have to reply on either the product warranty or on a third-party service contract to protect their purchases. The reason we mention this is because while Apple reveals how much product it sells in the U.S. and how much it sells elsewhere, it does not make that distinction for either gift cards or AppleCare premiums.
And so, in Figure 7, we are going to make our own estimates. And we're going to preface those estimates with our caution that they are almost certainly incorrect. First, the attach rates for AppleCare are higher in the U.S. than elsewhere. Second, the attach rates for AppleCare would be 0% in the numerous countries where Apple product are sold but AppleCare protection plans are not.
With that in mind, we estimate that of the $5.6 billion in AppleCare deferred revenue on the books at the end of September 2018, about 37% came from U.S. buyers while 63% came from elsewhere. That was about the same ratio we estimated for fiscal 2017. And it was a little more balanced than in fiscal 2015 and 2016, when we estimated only 35% came from U.S. sales.
Figure 7
Apple's Protection Plans:
AppleCare US Sales vs. International Sales
in Fiscal Years 2003 to 2018
(in Millions of U.S. Dollars)
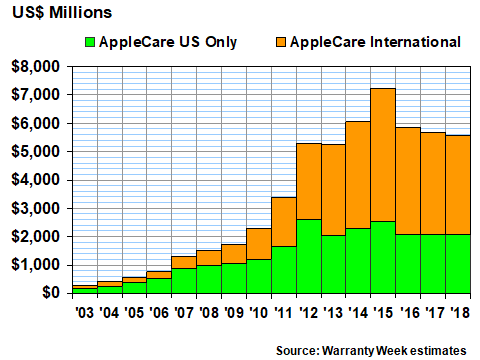
Note that the U.S. portion is estimated to be almost identical in size for the last three fiscal years. Actually, the amount was slightly larger in fiscal 2017 than in either fiscal 2016 or 2018, but the difference was minimal. Suffice it to say that we estimate that U.S. sales of AppleCare protection plans have remained flat for the past three years. International sales have been declining.
Apple's Product Mix
Besides geography, the other way we can slice and dice the extended warranty estimates is by the type of product they protect. Again, the comparisons are probably wrong, because the attach rates for Mac, iPhones, and other products are different, and the availability of protection plans in any given country around the world is different for each product. But again, we forge ahead, ignoring generally accepted accounting principles.
Figure 8 is a simple chart of what Apple itself reports as the percentage of revenue attributable to the iPhone, Mac, iPad, iPod, and other sources. Notice that the iPhone doesn't appear until fiscal 2007, while the iPad doesn't appear until fiscal 2010. Meanwhile, Apple stopped counting the iPod separately in fiscal 2015, adding it into the "other" pile. And it recently announced that it will stop reporting iPhone sales soon. So this may be the last time we can ever run a chart like this.
Figure 8
Apple's Product Mix
Percentage of Revenue, 2003 to 2018
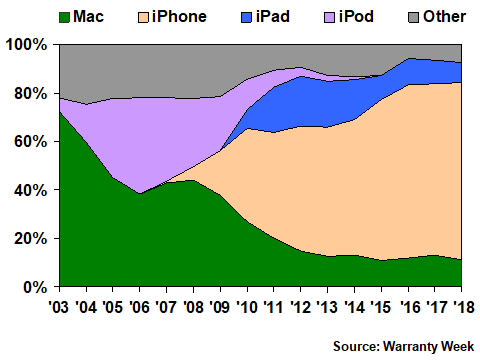
As we said, protection plans accounted for about 2.7% of product revenue in fiscal 2018. But it's highly unlikely that they accounted for 2.7% of each and every product line's revenue. Some might be higher and some might be lower. And again, the worldwide availability of products vs. protection plans, and the popularity of protection plans in the various countries, would drive that percentage rate both up and down.
But what if it were the same attach rate for every product sold in the U.S.? And what if we divided the product line into iPhone and iPad on the one hand and everything else on the other hand? If that were the case, then we would end up with something akin to Figure 9, which estimates the relative shares of the iPhone/iPad and everything else sold in the U.S. market.
Figure 9
Apple's Protection Plans:
AppleCare US for iPhone/iPad vs. Mac
in Fiscal Years 2003 to 2018
(in Millions of U.S. Dollars)
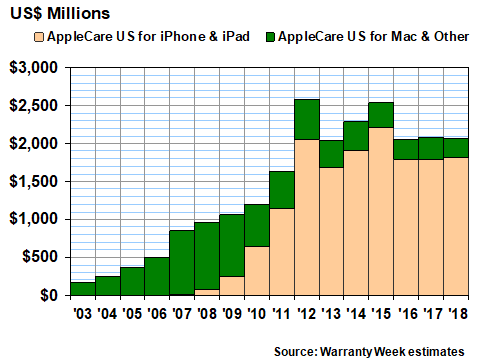
We estimate that the iPhone and iPad have accounted for half or more of the protection plans sold in the U.S. since at least fiscal 2010. In fiscal 2018, their share rose to a record 88% of the $2.07 billion we estimate was the size of the U.S. AppleCare program. The Macintosh and other products accounted for the remaining 12% of AppleCare premiums paid by U.S. customers, we estimate.
Relatively Unchanged
We also note that both the relative amounts and the relative shares of the total reflected in Figure 9 have not changed much in the past three years. In other words, the size of the program is relatively unchanged, and the iPhone/Mac split is also relatively unchanged.
What we are suggesting is that AppleCare sales worldwide have peaked and are declining slowly (Figure 4), are accounting for a decreasing share of revenue (Figure 5), are declining faster internationally than within the U.S. (Figure 7), and may actually still be growing within the U.S. for just the iPhone family (Figure 9). But the past few years have been more or less flat, stable, static, stagnant, steady or sluggish, depending upon whether you're bullish or bearish on the company itself.