


Nine-Month Warranty Expense Data:
While vehicle and building trade warranty expenses continue more or less unchanged, high-tech electronic warranty spending is still falling. And a new accounting rule is forcing companies to separate break/fix warranties from sales returns, reducing some expense totals significantly.
Given that the year is ending in a few weeks and the third-quarter financial reports were filed a few weeks ago, we thought it a good opportunity to see where things stood across all industries, and not just with new homes and vehicles. So we compiled the warranty expense reports of some 500 or so U.S.-based warranty providers and organized them into 18 different industries so we could bring you a nine-month status report.
Usually, we do this only once a year, when all the annual reports have been filed in March. That's because there are roughly 38 U.S.-based companies that report their warranty expenses only once a year, at the end of their fiscal years in their annual reports. And only a handful end their fiscal years in September. For the others, there is no new warranty data available, except in March.
Industry Estimates
Therefore, to put this week's report together, we had to include place-saving estimates based on 2017 spending levels for those companies, so that we had no blanks for the first, second, and/or third quarters of 2018. However, in three months, we will replace these estimates with real data when the annual reports are published. And that will necessarily change the totals and averages presented here, as the estimates are replaced with facts.
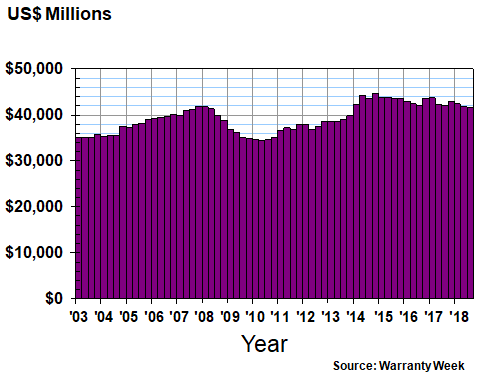
In Figure 1, we're looking at the quarterly claims payments of four industry sub-groups collected together under the heading of "vehicles." These include the manufacturers of cars, trucks, auto parts, and planes, and other similar products. For instance, motorcycles are included under cars, and construction equipment is grouped with trucks.
The vehicle sector saw a 2.5% increase in claims payments from the third quarter of 2017 to the third quarter of 2018. However, the car manufacturers were the only one of the four industry groups to see an increase. The others saw relatively small declines.
Figure 1
Worldwide Warranty Claims Payments
of U.S.-based Vehicle Makers
(claims paid in US$ millions, 2003-2018)
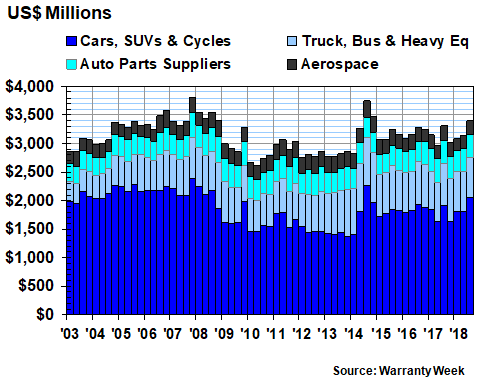
In previous newsletters, we've already noted that manufacturers in the car, truck, and auto parts categories are currently paying the most claims per quarter since 2014, when both General Motors Co. and Navistar International Corp. were in the midst of large recalls. So far in calendar 2018, their claims payments are up by $242 million from the first nine months of 2017.
Electronics Sector
In the seven high-tech electronics industries, claims are up ever-so-slightly during the first nine months of 2018, compared to the same period in 2017. Semiconductors and printed circuit boards saw a massive increase in claims, but both telecom equipment and data storage systems saw massive decreases that mostly offset those gains.
In the semiconductor category, KLA-Tencor Corp. was the biggest surprise. In the third quarter, the company adopted a new Accounting Standards Codification that affects revenue recognition (ASC 606), which in turn affects warranty expenses.
"Prior to adoption of ASC 606, the Company accounted for the estimated warranty cost as a charge to costs of sales when revenue was recognized. Upon adoption of ASC 606, the standard warranty for the majority of products is recognized as a separate performance obligation," the company explained. And so, the company slashed its warranty reserves from $42 million in June to only $347,000 in September.
Elsewhere in the semiconductor and printed circuit board category, Applied Materials Inc., Coherent Inc., and Lam Research Corp. each reported significant increases in claims payments. Cree Inc. was one of the few large companies in the category to report a decline in claims.
In the data storage category, NetApp Inc., Western Digital Corp., and Seagate Technology plc each reduced their claims payments considerably during 2018. In the telecom equipment category, Netgear Inc. led the declines, again citing an ASC 606-related reclassification as the cause. Basically, it reclassified the majority of its warranty claims as sales returns, because the main defect of the products was that nobody bought them.
Figure 2
Worldwide Warranty Claims Payments
of U.S.-based High-Tech Manufacturers
(claims paid in US$ millions, 2003-2018)
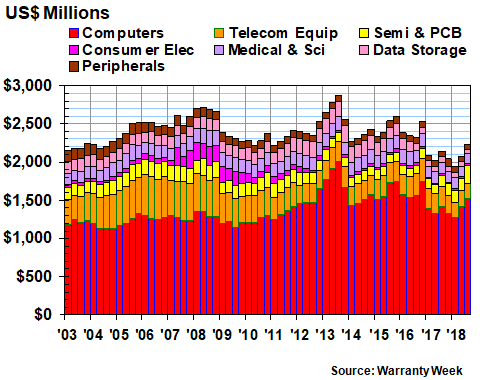
In the third quarter, the companies in the electronics sector paid $2.23 billion in claims, up about 4.3% from the same quarter in 2017. However, there was a massive drop in claims during the first quarter, and only a modest increase in the second quarter. So for the year so far, claims are up only $1.2 million, or 0.02%.
Building Trades
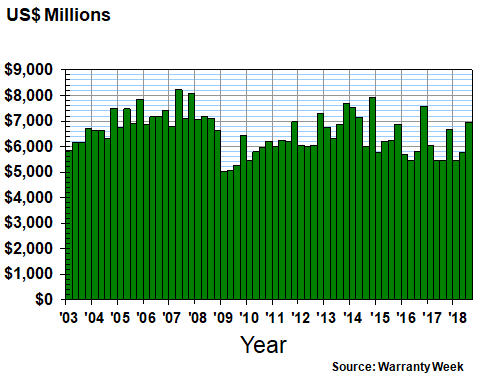
We took a look at the new home building industry two weeks ago. Now we'll take a look at the rest of the building trades, which includes six other industry groupings. All but security and sports equipment have seen claims increases so far this year, with material handling showing the largest proportional gain. Most of that was linked to Baker Hughes, a GE company, which saw its claims payout rise from $33 million in 2017 to $83 million in 2018.
In the appliance and HVAC category, Lennox International Inc., A.O. Smith Corp., Ingersoll-Rand plc, and Middleby Corp. each saw moderate increases in claims payments, while Whirlpool Corp. and Ametek Inc. each saw moderate declines. Helen of Troy Ltd., meanwhile, decided to stop reporting its warranty expenses at the end of its fiscal year on February 28, 2018. Having paid roughly $46 million a year in claims for the past two years, this is a significant disappearance.
Figure 3
Worldwide Warranty Claims Payments
of U.S.-based Building Trade Companies
(claims paid in US$ millions, 2003-2018)

Overall, the seven building trade sectors paid out $1.25 billion in claims during the third quarter of 2018, a 17.6% increase from the same period in 2017. For the nine-month period, their claims total was $3.31 billion, up by $289 million or 9.5% from the same period in 2017.
Warranty Accruals
We won't break out the warranty accruals by industry for this interim report, since we will do so in detail in the spring of 2019. But in Figure 4, we're charting the amount of warranty accruals reported by all U.S.-based companies for the past 63 quarters, since the start of 2003.
Figure 4
Worldwide Warranty Accruals
of U.S.-based Companies
(accruals made in US$ billions, 2003-2018)
In the third quarter of 2018, we estimate that manufacturers made a total of $6.93 billion in warranty accruals, up by a massive 27% from 2017 levels. However, keep in mind that for the 38 companies that disclose their warranty expenses only once a year, such as General Electric Co., Honeywell International Inc., and Eaton Corp., we had to insert place-saving estimates that added up to roughly $430 million per quarter. But that couldn't have caused the massive increase, because we essentially kept their estimated accrual levels the same as they were in 2017.
Instead, the biggest increases came from companies such as Apple Inc.; Cummins Inc.; United Technologies; Ford Motor Co.; and Tesla Inc. These five companies by themselves raised their accruals for the first nine months of 2018 by more than $1.4 billion, compared to the same period in 2017. Partially offsetting their increased were massive declines in accruals reported by large manufacturers such as Caterpillar Inc.; Cisco Systems Inc.; General Motors Co.; Hewlett Packard Enterprise Co.; Netgear; and Whirlpool Corp.
Warranty Expense Rates
The problem is, some of these companies are so large that a rise or fall of $100 million in warranty expenses barely moves the needle in terms of expense rates. For instance, GM cut its accruals by $67 million, but because of its huge sales volume, that reduced its accrual rate by only a tenth of a percent, from 2.1% to 2.0%. Ford increased its accruals by $244 million, but its accrual rate rose by only two-tenths of a percent, from 1.5% to 1.7%. HP Inc. raised its accruals by $80 million, but because of a 14% sales increase, its accrual rate remained about the same.
It's this interplay between claims, accruals, and sales that determines the percentage rates, of course. And after nearly 16 years of warranty expense reporting, we have come to know what to expect from these companies. So when they depart from their baseline, we know immediately that something very good or something very bad has happened (though we don't yet know if ASC 606 is good or bad for warranties).
In Figure 5, we've taken all of the claims and accruals reported by all the U.S.-based manufacturers and divided them by the corresponding product sales figures. We've done this 63 times since 2003, producing a record of what looks to be a decade-long decline in warranty expense rates. But look at what happened in 2013 and 2014. Expense rates actually rose a bit. And in 2015 they fell again. From 2016 until now, they rose and fell, again within that range of 1.1% to 1.5%. It's as if manufacturers ran out of ways to reduce their warranty costs.
Figure 5
All U.S.-based Companies
Average Warranty Claims & Accrual Rates
(as a % of product sales, 2003-2018)
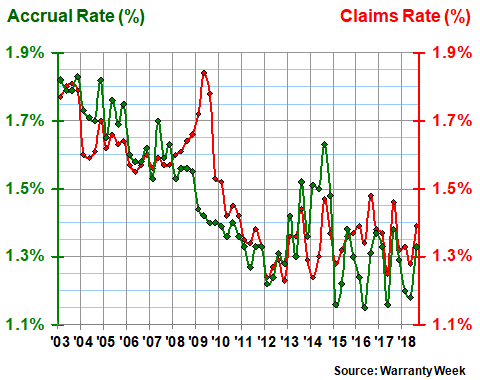
As of September 2018, U.S.-based warranty providers were spending an average of 1.4% of their product revenue on claims, and were setting aside about 1.3% of their revenue as warranty accruals. That's slightly below their year-ago average, and slightly more below their long-term 16-year average.
Changes in Expense Rates
These average warranty expense rates vary from one industry to the next, and can also vary depending on what a given company does and does not include in its calculations. For example, one company could price parts at their manufacturing cost, while another could price them at full retail, tax included. Some companies include a portion of their call center costs. Others don't. There's no definitive list of how it should be done.
Therefore, one cannot easily reach any conclusions when comparing the warranty expense rates of two different companies. Especially in light of the reclassifications resulting from ASC 606 adoption, there seems to be lots of sales returns and customer goodwill out there masquerading as warranty work. Netgear and KLA-Tencor can't be the only two.
To compile the data in Figures 6 and 7, we began by calculating the top 100 warranty providers for the first nine months of 2017, based on the amount of claims paid by each company during that period of time. Actually, we had to figure out the top 112 warranty providers, because 12 of the largest won't report their 2018 warranty data until next year. Next we took note of their claims and accrual rates at the end of the third quarters of 2017 and 2018. Then we calculated the biggest increases for each expense rate during that time interval.
In effect, we are comparing each company to itself over time. In doing so, we're not comparing the companies against each other, because different companies may calculate their warranty expenses in different ways, and they may not be as thorough when it comes time to segmenting their revenue (we try to use only warranted product revenue in our calculations, but some companies are more opaque). But whatever way they do it, we have to believe that they're consistent from year to year, so comparing their expense rates over time is a valid exercise (but ASC 606 reclassifications would be an exception).
In Figure 6, we're listing the ten proportionally largest increases in warranty claims rates during the year between September 2017 and September 2018. For instance, Lam Research more than doubled its claims rate, from 1.8% at the end of the third quarter of 2017 to 3.7% at the end of the third quarter of 2018. Lear's claims rate rose by almost a third, as did the claims rates of Bio-Rad and Applied Materials.
Figure 6
Top 100 U.S.-based Warranty Providers:
Top Ten Claims Rate Increases,
First 9 Months 2018 vs. 9 Mo. 2017
(claims as a % of product sales)
| Claims | Latest | Rate | |
| Paid ($m) | Claims | Year | |
| Company | 9mo18 | Rate | Ago |
| Lam Research Corp. | $196 | 3.7% | 1.8% |
| Baker Hughes Inc. | $83 | 0.9% | 0.4% |
| United Technologies Corp. | $380 | 1.2% | 0.6% |
| Tempur Sealy International | $32 | 1.6% | 0.9% |
| Pentair plc | $43 | 1.9% | 1.3% |
| Coherent Inc. | $40 | 2.7% | 1.8% |
| HNI Corp. | $22 | 1.3% | 1.0% |
| Bio-Rad Laboratories Inc. | $28 | 1.7% | 1.3% |
| Applied Materials Inc. | $126 | 1.3% | 1.1% |
| Lear Corp. | $20 | 0.13% | 0.10% |
Source: Warranty Week from SEC data
We should note that because some companies do not include their year-ago warranty expenses in their financial statements, our year-to-year calculations do not always take account of acquisitions and divestitures. For instance, in April, Pentair spun off its electrical business into a new entity called nVent Electric plc. Its new claims rate of 1.9% is for the remainder of the company. But the year-ago 1.3% claims rate is for Pentair plus nVent. And nVent does not publish its warranty expenses, claiming that they're "not material."
Top Accrual Rate Changes
With the accrual rate, a company is supposed to keep it the same unless they expect a change in failure rate or repair cost in the future. In other words, if a company is currently accruing $100 per product sold, it should continue accruing $100 per product sold unless it expects expenses to change. But it would also have to account for inflation in both product price and repair costs.
The bottom line is that accrual rates should be more stable than claims rates. For instance, the accrual rate should not rise because of a drop in sales. If sales decline, accruals remain proportional to sales, and so accruals decline as well. And when the accrual rate rises, it does so because the company believes claims are going to rise soon as well. In other words, it sees a problem ahead.
In Figure 7, we've taken the accrual rates of all of the top 100 warranty providers and calculated the ten largest proportional increases from September 2017 to September 2018. For instance, NetApp's accrual rate rose more than three-fold, from 0.14% in September 2017 to 0.46% in September 2018. Rockwell Collins saw its accrual rate rise by more than a third, from 1.0% to 1.4%. NetApp's accrual rate increase came despite a 21% increase in sales. Rockwell Collins, meanwhile, was acquired by United Technologies Corp. in November, so this is its last appearance as a separate company.
Figure 7
Top 100 U.S.-based Warranty Providers:
Top Ten Accrual Rate Increases,
First 9 Months 2018 vs. 9 Mo. 2017
(accruals as a % of product sales)
| Accruals | Latest | Rate | |
| Made ($m) | Accrual | Year | |
| Company | 9mo18 | Rate | Ago |
| NetApp Inc. | $12 | 0.46% | 0.14% |
| United Technologies | $472 | 1.4% | 0.7% |
| Allison Transmission | $30 | 1.3% | 0.7% |
| Pentair plc | $43 | 1.9% | 1.2% |
| Lam Research Corp. | $198 | 3.0% | 2.0% |
| Cummins Inc. | $793 | 4.5% | 3.0% |
| HNI Corp. | $22 | 1.33 | 0.95% |
| Rockwell Collins Inc. | $85 | 1.39% | 1.0% |
| Regal-Beloit Corp. | $17 | 0.6% | 0.5% |
| Coherent Inc. | $45 | 3.1% | 2.4% |
Source: Warranty Week from SEC data
Note that five companies made both lists: Coherent; HNI; Lam Research; Pentair; and United Technologies. This means that among all the large U.S.-based warranty providers, they saw the biggest expense rate increases of the first three quarters of the year, and one rate increase confirmed the other. That's not good. Their warranty managers will probably be getting coal in their stockings this holiday season.
We didn't make charts for all the companies that saw their claims and accrual rates decline the most, but we'll tell you what they would have shown. Six companies made both lists, meaning that their claims and accrual rates fell the most. They are: Aptiv plc (formerly Delphi); Cree; IBM; Itron Inc.; Netgear; and Sherwin Williams Company. For them, congratulations are in order.
Interestingly, one of the companies that made the list in Figure 6 was also among the top 10 accrual rate declines. While Lear saw its claims rate rise from 0.10% to 0.13%, it nevertheless cut its accrual rate from 0.08% to 0.05%. But those are relatively small changes, even if they are in contradictory directions. Unlike in years past, we have not yet seen any companies cut their accruals by huge amounts in spite of huge increases in claims payments.
Warranty Reserves
In Figure 8, we're looking at the sum of all the warranty reserve fund balances of U.S.-based warranty providers at the end of the past 63 quarters. On September 30, 2018, that balance was $41.5 billion, down about $573 million or 1.4% from a year before. And it was the first dip below $42 billion since the end of 2013.
Figure 8
Worldwide Warranty Reserves
of U.S.-based Companies
(reserves held in US$ billions, 2003-2018)
In pure dollar terms, some of the largest reserve fund balance reductions were reported by Apple; Aptiv; Ford; GM; and Navistar. Aptiv also scored high proportionally, reducing its reserves by more than two-thirds. But the biggest percentage reduction was reported by Netgear, which cut its reserves from $68 million to $19 million, a 73% decline.
Some of the largest dollar-denominated increases were reported by Cummins; Deere & Co.; Lennar Corp.; and Tesla. Just those four raised their reserve balances by a combined $1.17 billion, led by Cummins' $568 million increase, required to deal with emissions-related engine recalls.
Tesla and Lennar also scored high on the list in terms of percentage increases. But Tesla is growing much faster than its warranty expenses, and Lennar is acquiring former competitors such as CalAtlantic Group Inc. Others towards the top of that list included Baker Hughes; Colfax Corp.; and D.R. Horton Inc.
Status Quo?
Once again, as in the past two newsletters, we cannot find any evidence of a slowdown in the latest warranty expense data. Claims are up 5.6%. Accruals are up 27%. And sales are up 10%. The only metric that's down is the warranty reserve balance total, and that decline is only 1.4%.
That doesn't mean there won't be a slowdown, but it does mean that this time we're not seeing the same kinds of clues we saw in 2006 and 2007. Individual companies seem to be facing challenges with recalls and regulators, not to mention new accounting rules that force them to separate real warranty costs from make-believe warranty costs. But there's no widespread downturn evident in the data.


