French Automaker Warranty Expenses:
Renault has always kept its warranty expenses low, but three years ago PSA suddenly cut its costs by more than two-thirds. Now they're creeping up again as the makers of Peugeot and Citroen works to integrate the acquisitions of Opel and Vauxhall it made from GM.
Sometimes, the data doesn't look right. In the July 11 newsletter, we detailed the warranty expenses of four European automakers: Volkswagen, BMW, Daimler, and Fiat. This week, as we continue on our way towards a worldwide auto warranty estimate, we are adding data for the two top French automakers: Groupe PSA, makers of the Peugeot, DS, and Citroen nameplates, and Groupe Renault, which also manufactures the Alpine, Dacia, and Avtovaz nameplates.
They're getting their own newsletter this week because, as we shall see, their warranty metrics are very different from the other European carmakers. Because of their unusually low expense rates, they seem to have more in common with the Chinese car manufacturers or with the pre-JLR Tata Motors in India than they do with their European peers, some of whom happen to have the highest warranty costs in the world.
We extracted three warranty metrics from the past decade's PSA and Renault financial statements: the amount of claims paid per year, the amount of accruals made per year, and the amount of reserves held at the end of each year. We also noted the annual automotive revenue figures and the number of vehicles each company sold per year.
With the claims, accrual, and sales revenue data, we calculated a pair of percentages: claims as a percent of sales, and accruals as a percent of sales. Using the accrual total and the vehicle sales total, we also calculated the amount of accruals made per vehicle sold.
Warranty Claims Totals
The problem we encountered is visible in every one of the charts that follows. In Figure 1, we are counting the total claims payments for PSA and Renault from 2009 to 2018. The Renault data looks steady and consistent, but the two-thirds dive in PSA's total from 2015 to 2016 looks peculiar, to say the least. But we assure you, these are the numbers the annual report contains.
Figure 1
French Auto Manufacturers
Claims Paid per Year
(in millions of euro, 2009-2018)
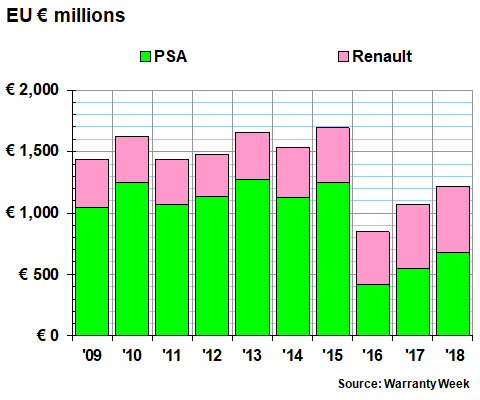
Nowhere in that annual report is there any explanation for the drop -- a change in methodology, or perhaps a revision in the way claims payments are counted. One year, PSA paid 1.5 billion euro in claims. The next year, it paid only 415 million euro -- a 67% decline. And it went from paying nearly three times as much as Renault in 2015 to slightly less than Renault a year later.
It would make perfect sense if PSA had sold off an entire division, like Daimler did a decade before. But precisely the opposite has happened to PSA. Sales are growing organically and the company is also making large acquisitions. It sold just under three million vehicles in 2015, and just over three million vehicles in 2016. But then in mid-2017 it acquired the Opel and Vauxhall brands from General Motors, and last year it sold nearly 3.9 million vehicles, a new record.
Last year, as the effects of that acquisition were fully felt, PSA's claims cost did actually rise 23%, to 674 million euro for all of 2018. Meanwhile, Renault's claims cost remained about the same -- 542 million euro, up by 17 million or three percent. By the way, the reason we spell out the word euro rather than using the currency symbol is because readers tell us that some email systems and web browsers don't display it correctly. It's the same reason we don't include the umlaut on top of the e in Citroen -- sometimes it appears as gibberish.
Claims Rates
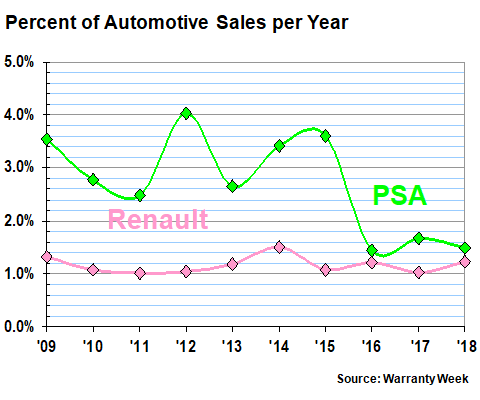
The same sudden drop-off is evident in Figure 2, which takes the totals from Figure 1 and divides each by the corresponding sales totals. PSA spent 2.3% of its sales on claims in 2015, and only 1.1% in 2016. Claims rates don't usually fall by half in a single year absent some major corporate reorganization.
Figure 2
French Auto Manufacturers
Warranty Claims Rates
(as a percentage of sales, 2009-2018)

Last year, as the Opel and Vauxhall revenue was added to the Peugeot and Citroen base, PSA's claims rate fell to its lowest level of at least the last decade: 1.10%, slightly lower than even 2016. Meanwhile, Renault's claims rate rose slightly last year, to exactly one percent. But it's remained within a tight range of 0.9% to 1.2% for the entire past decade.
Warranty Accrual Totals
In Figure 3, we're adding up the totals for warranty accruals over the past ten years. Once again, there's a sharp drop-off for PSA from 2015 to 2016, while Renault's total remains about the same. but accruals rose for both companies last year -- PSA's grew by 234 million euro, while Renault's grew by 103 million euro.
Figure 3
French Auto Manufacturers
Accruals Made per Year
(in millions of euro, 2009-2018)
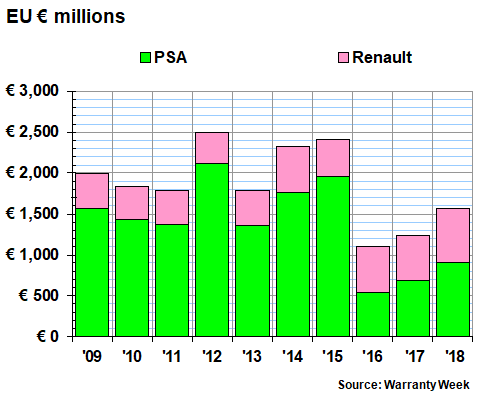
It was the third consecutive accrual increase in accruals for PSA, while Renault was up in 2018 after being down in both 2015 and 2017. Note that in 2016, for the first and only time in the last decade, Renault accrued slightly more than PSA. But in 2018, PSA accrued 250 million euro more than Renault, even though Renault sold nearly a million cars more than PSA.
Accrual Rates
In Figure 4, we're taking the totals from Figure 3 and once again are dividing each by the corresponding sales revenue totals. As with the claims rates calculated in Figure 2, the rates for the two French automakers were very far apart from 2009 to 2015, but have been relatively close from 2016 to 2018.
Figure 4
French Auto Manufacturers
Warranty Accrual Rates
(as a percentage of sales, 2009-2018)
In 2018, PSA set aside 1.5% of its automotive revenue as warranty accruals, while Renault set aside 1.2%. For PSA it was a decrease from 2017, while for Renault it was an increase. However, for the past ten years, Renault's accrual rate has remained relatively stable, close to 1.2%, while PSA's accrual rate averaged 3.2% from 2009 to 2015 and 1.5% from 2016 to 2018.
Accruals per Vehicle Sold
The same before-and-after effect is evident in Figure 5, which takes the amount of accruals made in Figure 3 and divides it by the number of vehicles sold. Since the traditional methodology is to first estimate the future cost of warranty per unit and then to set aside that amount when a vehicle is sold, this calculation provides a window into the thinking of the companies regarding how much they expect to spend on warranty in years to come.
According to these calculations, PSA executives expected to spend an average of 658 euro on the warranties of vehicles sold in 2015, but a year later their expectation for warranty expenses per unit dropped to only 170 euro. Last year, as Opel and Vauxhall came on board, PSA's accruals rose to 235 euro per vehicle. Renault's also rose, from 148 euro in 2017 to 170 euro in 2018.
Figure 5
French Auto Manufacturers
Accruals Made per Vehicle Sold
(in euro, 2009-2018)
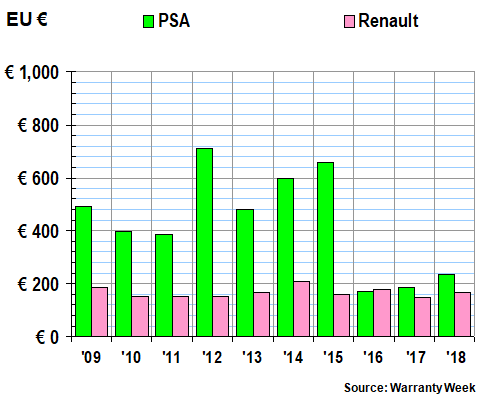
These are radically lower amounts than are typical in Europe. For instance, Fiat Chrysler Automobiles accrued 493 euro per vehicle sold last year. BMW accrued 738 euro per vehicle. So FCA's accrual is nearly three times larger than Renault's, and BMW's is more than three times larger than PSA's.
Last week, we found that the four Chinese automakers were accruing between US$37 and US$98 per unit sold in 2018. With the exchange rates prevailing now, this means the French are paying two to seven times as much per unit as the Chinese. And then BMW and FCA are paying roughly three times as much as the French.
Warranty Reserves
Our final warranty metric is the balance left in the warranty reserve funds of the two companies at the end of each of the past years. As can be seen in Figure 6 below, PSA's balance dropped off rather dramatically from the end of 2013 to the end of 2014. But it's been growing ever since, and in 2018 it was back over 1.5 billion euro. Meanwhile, Renault reported holding a billion euro in its warranty reserve fund for the first time at the end of 2018.
Figure 6
French Auto Manufacturers
Reserves Held at Year's End
(in millions of euro, 2009-2018)
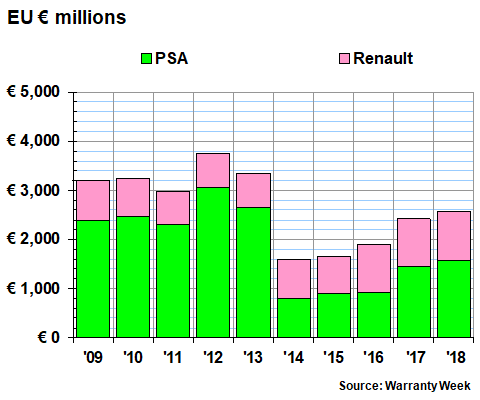
So that's the overview of a most curious set of warranty metrics for the French auto manufacturers PSA and Renault. From 2015 to 2016, PSA's claims fell by more than two-thirds, and its accruals fell by more than 70%. And then from 2013 to 2014, its reserves fell by more than 70% as well.
Meanwhile, Renault is more or less steady as she goes, with remarkably little variation over the past ten years. One company undergoes a radical transformation in which its warranty expenses are slashed in a year, while the other reports only minor fluctuations.
What makes the story more believable, in fact, is that for the past three years, PSA's post-slashing warranty metrics have been more like Renault's. They're almost twins. But in the previous seven years, PSA's warranty metrics were more like Fiat's.
Other Major Changes
The other radical transformations we've seen were directly attributable to either acquisitions or divestitures. After Daimler sold Chrysler, its warranty costs fell substantially. After Fiat bought Chrysler, and after Tata bought Jaguar Land Rover, their warranty costs rose substantially. PSA's warranty costs are rising again now, but not as radically as they fell after 2015 (the Opel/Vauxhall merger was announced in early March 2017, and completed during the summer, so it had no effect on the 2016 metrics).
And with the French OEMs present and accounted for, the worldwide automotive warranty pie chart is now almost completely filled in. We still have some Korean and Indian OEMs to check in upon, but with the warranty data we already have in hand, it looks like both PSA and Renault are still in the top 20 worldwide, in terms of claims paid. Together, they account for about a three percent slice of the worldwide claims pie -- a little bit more than Kia and a little bit less than Hyundai. But we'll get to those details in next week's newsletter.