Warranty Reserves:
While the average manufacturer spends 1.9% of product revenue on warranty claims and keeps a little over a year's worth of funds in reserve, each industry is different. Computer manufacturers and automakers fund their warranty programs at different levels than telecom or aerospace manufacturers. But in any group, as with any trend, there's always the odd man out.
Look in almost any manufacturer's financial statement and you'll always find a sentence or two about the adequacy of warranty reserves. Chief financial officers always claim the level of reserves they keep and the rate of accruals they make is adequate to pay all future warranty claims, and that they use the latest forecasting tools to finely tune their estimates.
In the old days, before comprehensive warranty disclosures began last year, we'd have to take them at their word. What was adequate? A level which never resulted in an earnings shock was considered adequate. Future estimates were adequate only in hindsight. As long as there was enough money on hand to pay claims, as long as an unexpected additional accrual wasn't needed, as long as mentions of warranty in the financial statements never rose above the level of boilerplate phrases for the 10-K, the CFO was doing his job well.
Now that some 750 manufacturers are routinely providing hard numbers regarding the beginning and ending balances of their reserve funds over the course of the year, along with exact figures for net claims and net accruals, it has become possible to measure the adequacy of a given reserve fund against more objective criteria. Companies can't be compared against each other -- the accounting is still too fuzzy for that -- but companies can now be compared against themselves. For if we know how much a given company is paying in warranty claims per month, and we know the balance of their reserve fund, we can compute exactly how many months those funds would last if no further accruals were made. In years to come, it will be possible to compare today's predictions (accruals) against tomorrow's actual claims rates, and to see if reserves were really adequate.
The Odd Man Out
One would think that CFOs in similar situations at similar companies would make similar choices towards the high or low end of the scale for reasons peculiar to that line of business. Four automakers or four computer manufacturers would follow similar patterns, tending towards the same optimistic or conservative planning assumptions about product warranty. But it turns out that for every pattern there's always an exception. In any group of four, there's always the odd man out.
Imagine that the warranty reserve fund was a water tank. The beginning and ending balances are the water level inside the tank at the beginning and the end of the month. Warranty claims, the outflow, is the amount of water taken out of the tank over course of the month. Accruals, the inflow, is the amount of water added over the course of the month. Now imagine the inflows ceased. How long would the water last before the tank ran dry?
It doesn't matter what size tank. Whether a company is spending a thousand or a million dollars a month, this measure of capacity results in a ratio. Most CFOs, it turns out, like to keep that ratio between 10 and 20 -- that is, between 10 and 20 warranty-months. In other words, the balance of their warranty reserve fund is usually between 10 and 20 times larger than the amount spent in cash (or in kind) per month honoring warranty claims.
There is no "right" number. But there is such a thing as a middle number -- a ratio between reserves and claims that half the CFOs are above and half the CFOs are below. Warranty Week has measured this ratio four times through the past year, and we went back and remeasured it again this week, using all the new data that has become available over the course of the year. For instance, many companies decided to begin their warranty disclosures with their 2003 annual reports, providing data that was not available at the time of the first, second, and third quarter filings. Some of these companies, such as Motorola, Eaton, and Textron, turned out to be among the biggest warranty providers of all.
Once all the new data was compiled, the median for all U.S.-based manufacturers turned out to be in a range of 13.7 to 15.1 warranty-months. It fluctuates each quarter, not only as CFOs adjust their accruals to match actual spending, but also as claims rise and fall based on seasonal factors, product trends, and a dozen other variables. In fact, some small portion of the fluctuations are caused by changes in currency exchange rates, which increases the cost of a claim made overseas when the dollar is falling.
Warranty Claims Percentage Rates
We've also been compiling statistics for another key ratio: between warranty claims and product sales. This answers the question of what percentage of product sales a given company spends honoring warranty claims. The weighted average has fluctuated around 1.9% all year. But again, there is no "right" number. Most companies seem to be in a range of 1% to 5%, although a large group are below 1% and a much smaller handful are above 5%. There are, in fact, a couple of companies above 10% and there's even three above 20%.
How long a company can continue spending more than 20% of its revenue fixing broken products remains to be seen. Earlier in 2003, there were six companies paying out more than 20% in claims. Three of those companies have now shut their doors, including one which saw both sales collapse and claims spike at the same time, resulting in incredible 300% claims rates (claims on old products were three times larger than sales of new units).
Now imagine the world of manufacturers divided in half, based on which are above and which are below the median for reserve fund capacity ratio. Then take each group and divide it in half again, based on whether they're above or below the weighted average for claims as a percentage of sales.
In the chart below, the top 250 warranty providers of calendar year 2003 are divided based on which of these four groups they fall into. The companies in Quadrant I, in the lower left, are below 1.9% in their claims ratio and below 14 warranty-months in their reserve capacity. This means they experience low claims rates and they keep less money on hand to pay them, in comparison with other manufacturers.
All kinds of companies fall into the orange quadrant, but in particular there are quite a few manufacturers of medical equipment, scientific instruments, and semiconductor test equipment. Perhaps quality is higher, and claims are less likely, or product testing is much more thorough before shipments are made? Whatever the reason, these are the companies for whom warranty is not a major cost of doing business.
Warranty Claims Rates
and Reserve Fund Capacity
for Top Manufacturers

The vertical scale is logarithmic, to compress the spread of the reserve ratios. Ten means a company has ten times as much as it spends on claims per month in reserve, while 100 means a company has 100 months in reserve. The horizontal scale is in percent, based on warranty claims divided by sales revenue. A 2% rate means $2.00 is spent on claims for every $100 in product sales.
The companies in Quadrant II, pictured in red, experience higher-than-average claims rates, yet they still keep relatively smaller amounts of money in their reserve funds to pay future claims. Many of the computer companies fall into this quadrant, as do many of the consumer electronics manufacturers. For whatever reason -- shorter warranties, rapid obsolescence, or low per-unit prices -- these manufacturers tend to keep their reserves as small as possible.
Up in Quadrant III, in the top-right corner, are the companies which spend a higher proportion of sales revenue on warranty claims and which keep a higher multiple of claims in their reserve funds. It's no surprise that this is the home of both General Motors Corp. and Ford Motor Co., who each spend more than $300 million a month honoring warranty claims and who each keep roughly 20 times that amount in their reserve funds. With the costs of past product recalls always fresh in their corporate memories, they're always financially prepared for the worst.
The companies pictured in light blue in Quadrant IV are in perhaps the best shape of all. They experience relatively low claims rates now, yet they keep relatively high levels of reserves. At any time, their CFOs could decide the reserve fund contains excess capacity, and they could drain some of those funds, adding them directly into net profits. Alternatively, they could lengthen their warranties from one or three years to five or ten years, and they could still have enough to pay claims.
A company in Quadrant IV can choose to move into the orange quadrant by making a sizeable downwards change of estimate. Or they can choose to move into the blue quadrant by liberalizing the terms of their warranties and increasing the payout. If they were auto manufacturers, they'd be following the trail blazed by Hyundai, Suzuki, Mitsubishi, and others, who have turned generous warranties into a competitive sales weapon. But strengthened warranties cost money and boost claims rates over the long term.
So far, Warranty Week hasn't seen too many companies moving from left to right, at least not in the limited number of quarters for which data is available. Still, there are a few notable exceptions. Nortel Networks started the year in Quadrant IV and moved into Quadrant III, but then they told their CFO and controller to pursue other interests and restated all their financials, particularly those related to past accruals. So they most definitely deserve the title of odd man out. No other major warranty provider made a similar leftward jump from Quadrants IV to III during 2003, although another telecom company spent nine months in Quadrant I and three months in Quadrant II.
Two shifts are worth noting, both of them proceeding from right to left. United Technologies Corp. began 2003 with a claims rate above 1.9% and a reserve fund capacity close to 30 warranty-months, placing it in the blue quadrant. But then the company began making downwards changes of estimates at the same time that claims rates were falling. As the chart below spotlights, there was a small shift from the first quarter to the second quarter, followed by a huge jump in the third quarter and a bit of circling back during the fourth quarter.
Warranty Claims Rates
and Reserve Fund Capacity
at United Technologies and Cisco, 2003
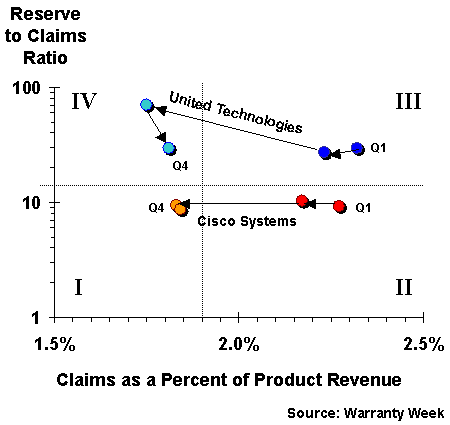
United Technologies is an amalgamation of several companies in multiple industries, including air conditioning, elevators, jet engines, helicopters, and avionics. For at least six consecutive quarters, the company paid out more than $30 million a month in warranty claims. Then during the third quarter, claims fell to just half that rate. As a result, the company's reserve fund capacity soared to 69 warranty-months. While it would be difficult to sustain this shift, what the chart above shows is that claims remain below average even after reserve capacity returned to historical norms. As will be shown later on, United Technologies was a bit of an odd man out when it was in the blue quadrant. Now it's closer to industry averages established by both HVAC and aerospace vendors.
A much more linear shift occurred at Internet router manufacturer Cisco Systems Inc. The company began 2003 with claims rates above 2.3% of product revenue, and reserve fund capacity around 9 warranty-months. While maintaining that capacity, the company cut claims rates for three quarters in a row, ending the year at 1.8%. But as the chart above suggests, the rate cut from the third to the fourth quarter was much smaller than was seen earlier in the year. For both these companies, it will be revealing to see whether they remain at their lower levels in 2004, or if they shift back from left to right.
The Typical Warranty Reserve
These are only two out of the more than 750 manufacturers who reported details of their 2003 warranty accounting records. Over the course of the year, according to financial reports files with the Securities and Exchange Commission, 732 U.S.-based manufacturing companies reported the three essential data points: their reserve fund balance, net claims paid, and product sales revenue. But all did not do so during each of the four quarters of 2003.
During the first quarter, 636 companies filed reports containing all three data points. The weighted average for claims rates was 1.93%, meaning that $5.7 billion in claims represented 1.93% of product sales revenue. The median for reserve fund capacity was 14.1 warranty-months. This is far below the weighted average of 17.2 warranty-months, but in this instance the median is a better expression of the planning assumptions of 750 different CFOs.
During the second quarter, 639 companies made the reports. Claims rates remained largely unchanged at 1.94% while the reserve fund median rose to 15.1 warranty-months. Claims jumped to $5.8 billion, but reserve funds grew proportionally faster.
During the third quarter, 656 companies made the required reports. Perhaps because of the many new arrivals or perhaps because of seasonal factors, both claims rates and reserve capacity fell. The claims rate slipped to 1.85% and reserve fund capacity fell to 14.3 warranty-months.
Finally, during the fourth quarter, 638 companies made the necessary reports of reserve fund balance, net claims paid, and product sales volume. Claims rates rose slightly, and capacity fell. The claims rate was 1.89% while the median reserve fund capacity was 13.7 warranty-months.
Quadrant IV was consistently the most crowded corner for the whole year. While mathematically there were always as many companies in Quadrants I & II as in Quadrants III & IV, there were always more companies in orange and light blue than in red and dark blue. The cause, of course, is the sheer weight of some of the companies involved in the weighted averages.
Of the $23.6 billion counted so far in 2003 warranty claims, Ford and GM accounted for roughly one-third of the total. They plus Dell, General Electric, IBM, Hewlett-Packard, and Caterpillar accounted for 57% of the total. The sheer weight of these companies largely determined the average claims rate. So while 50% were above and 50% were below the horizontal dividing line, 70% were to the left and 30% were to the right of the vertical divider.
The most populated corner was consistently Quadrant IV. The least populated was always Quadrant III. Of course, this was the home of GM and Ford, along with several other heavyweight automotive warranty providers. But look at the chart below. As measured by automotive product revenue, three of the top four manufacturers are in Quadrant III, but one is in Quadrant I of all places! Visteon Corp., with more than $17 billion in product revenue, reported only $17 million in warranty claims, giving it an almost imperceptible 0.1% warranty claims rate.
Warranty Claims Rates
and Reserve Fund Capacity
in the Automotive Industry
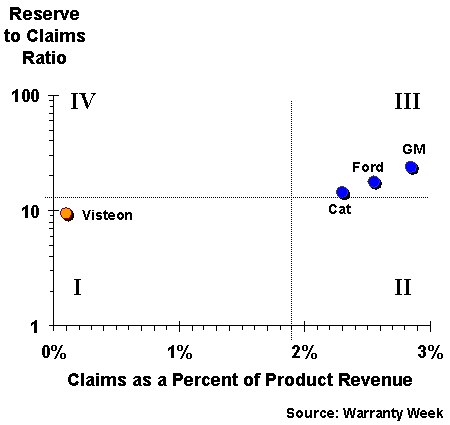
Of course, Visteon is a spin-off of Ford, and remains one of that company's major parts suppliers. Among other top auto component suppliers, Johnson Controls is up in Quadrant IV, but most of the big OEMs -- GM, Ford, Deere, Caterpillar, and Paccar -- are the heavyweights of Quadrant III. The suppliers are to the left, and the OEMs are to the right. We would suggest this backs up the theory that OEMs aren't recovering as much warranty expense from their suppliers as they possibly could.
What about other industries? While it's always possible to compute industry averages, it also seems inevitable that there's always an odd man out. For instance, the computer hardware industry always shows up with higher-than-average claims rates and lower-than-average reserve capacity. But not all computer manufacturers fall into Quadrant II.
In the chart below, three of the top four computer warranty providers fall into the expected range, with IBM, HP, and Sun each maintaining a reserve fund capacity around 9 or 10 warranty-months. And then there's Dell up in Quadrant III, with a reserve capacity around 18 or 19 warranty-months. Dell, in this case, is the odd man out.
Warranty Claims Rates
and Reserve Fund Capacity
in the Computer Industry
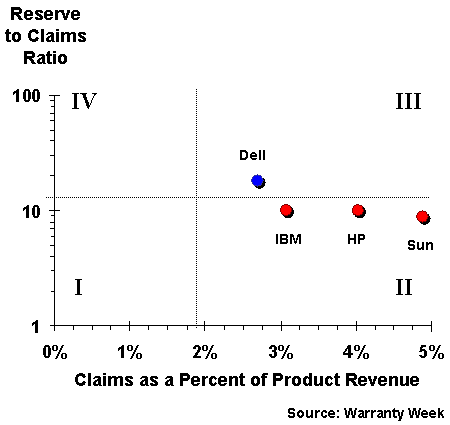
What this means is that although Dell, IBM, HP, and Sun each experience claims rates around 3% to 5%, the CFO of Dell has decided to maintain a reserve fund balance nearly twice as large as either of these competitors. This doesn't mean that any given warranty claim is more or less likely to get paid, or that any of these companies is in better financial shape than the others. But it does spotlight how four similar companies in the same industry can arrive at very different definitions of the word "adequate" when it comes to warranty reserves.
Reserve ratios are easy for a CFO to change, by raising or cutting accruals. Claims rates are much tougher to change. A few companies have successfully jumped across the divide by cutting claims. United Technologies and Cisco Systems are among the largest companies to steer their way across the midpoint in 2003, but as the charts below illustrate, many of their peers are already on the left side of the grid. Of the major telecom equipment providers, only Nortel with its accounting problems is in the high/high quadrant. Many other, such as Motorola and Lucent, are in Quadrant IV, with below-average claims rates and above-average reserves.
Warranty Claims Rates
and Reserve Fund Capacity
in the Telecom Industry
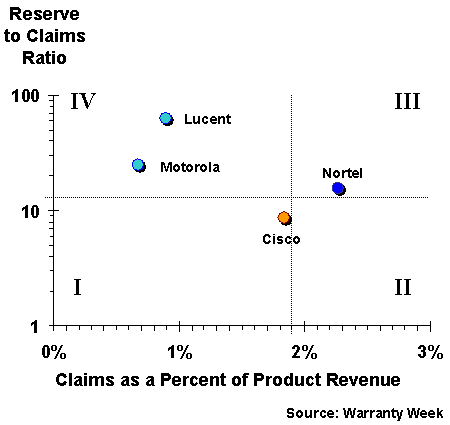
One should not conclude that all telephone, broadcasting, and data network equipment providers fall naturally into Quadrant IV. In fact, they're actually all over the map. Nortel, 3Com, and Juniper Networks are up there in blue while Avaya, Netgear, and Extreme Networks fall into the red corner. Motorola and Lucent are in IV, but Cisco and Tellabs are in Quadrant I.
Perhaps this is a sign that the "telecom" category is too broad a term, and that perhaps a better analysis would pair off just wireless companies, or just LAN companies, or just Internet companies. Some say this level of detail also is needed in the automotive category, which pulls in everything from batteries made for golf carts to the diesel engines powering locomotives.
Certainly, there are warranty differences based on product type and customer type. Central office switches are very different from cable TV set-top boxes in terms of longevity and durability. If your customer is one of the regional telephone companies or one of the major broadcast TV networks, your warranty experience will be very different than if your customers were millions of customers buying your products at retail.
Let's take a look at one more industry. As mentioned, United Technologies is a little bit aerospace, a little bit air conditioning, and a little bit elevators. Its warranty experience is a little bit of each.
Fortunately, air conditioning and airplane manufacturers both tend towards the conservative end of the spectrum. Perhaps because they typically provide warranties of medium to long term (five, 10, or even 20 years), and because they typically have been in business through numerous boom/bust business cycles (one opened its doors right after the Civil War), they all generally keep high levels of reserves on hand to pay claims. And perhaps because their products are expected to be so reliable, and last so long, claims rates are generally lower than average.
Still, United Technologies spent half of last year in Quadrant III before arriving in Quadrant IV. What's notable is that many of its competitors in aerospace and air conditioning were already there.
Warranty Claims Rates
and Reserve Fund Capacity
in the Aerospace Industry
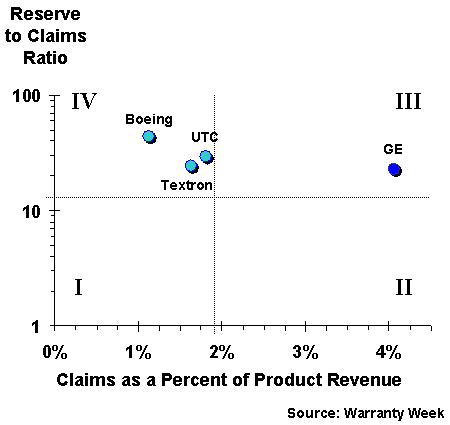
The most notable exception was General Electric, which reported $749 million in claims for 2003. The company said most of the claims were related to power turbines, of which about $18.5 billion were sold. Still, that's a 4% claims rate, although with a better accounting of warranted product revenue that rate would surely drop.
Among central air conditioning manufacturers, Lennox International has yet to file its fourth quarter financial statement, but York, Carrier (UTC), and Trane (American Standard) are firmly in Quadrant IV, along with refrigerated truck makers Ingersoll-Rand and Wabash National, ice machine maker Manitowoc Co. Inc., Masco, Tecumseh Products, Nortek, and Modine Manufacturing.
At the systems end, the big HVAC vendors see lower rates and keep higher reserves, much like new home builders. Many of the HVAC controls manufacturers -- Rockwell, Honeywell, and ITT -- are in Quadrant I, with lower reserves and lower claims rates than average. There's always a few exceptions to every rule, always an odd man out among the group.
By the way, there's a definite difference between the appliance and the systems end of the HVAC business that can be seen in the reserves and claims levels. At the appliance end, the window air conditioner vendors experience higher rates of claims and keep lower reserves, almost like consumer electronics manufacturers. You'll find Whirlpool and Maytag in the red corner, along with Fedders and Water Pik Technologies. The odd man out is the Holmes Group Inc., whose fans, heaters, and humidifiers experience almost imperceptible (0.04%) claims rates.
| Back to Part Two | Go to Part Four |


