 Warranty Week
Light and Dark Theme
Click to toggle the mode to your preference
About Warranty Week
Founded in 2002. Warranty Week is the premier newsletter for information on warranty management systems, claims management systems, online warranty processing services, extended warranty services, product warranty program administration, and online registration. We have published over 500 newsletters and are the most reliable source for all Warranty related news.
An online newsletter and website for warranty professionals, consisting of a free weekly newsletter emailed to subscribers, plus a website containing approximately 560 keyword-searchable pages, linked to a home page at https//www.warrantyweek.com/ and sponsored by top warranty and service contract companies such as PCMI Corp., Tavant Technologies, Marsh Inc., Syncron AB, and PTC.
Contact Warranty Week
Subscribe to Warranty Week's Newsletter
In our 22nd year of providing the latest & greatest Warranty Information.
-
U.S. New Home & Building Materials Warranty Expenses: Total warranty expenses in the industries that contribute to building new homes are rivaling those we saw right before the housing bubble burst in 2008. While the record highs for total claims and accruals are still 2007 and 2006, respectively, the new record high for warranty reserve balances was 2024.
Jun 26, 2025
-
U.S. Aerospace Warranty Expenses: Total warranty claims exceeded total warranty accruals in the U.S. aerospace industry, and for the three largest manufacturers by warranty costs, Boeing, RTX, and GE Aerospace. The industry average claims rate also exceeded the average accrual rate in 2024.
Jun 19, 2025
-
European Automaker Warranty Expenses: Total warranty claims payments increased by 15% from 2023 to 2024 among the European auto OEMs, while accruals increased by just 3%, and reserves increased by 2%. The European automakers accrued a median of €1,528 per vehicle sold.
May 29, 2025
-
The Impact of Tariffs on Home Appliances in the United States: This paper by VectorSolv CEO Aleem Lakhani presents an assessment of the impact of tariffs on the United States home appliance market. The findings reveal that while tariffs may yield short-term benefits to certain domestic producers, they tend to result in higher prices, reduced consumer welfare, and distortions in global supply chains. Furthermore, the repercussions of tariffs extend to aftermarket services and warranty providers, resulting in increased repair costs, logistical bottlenecks, and a shift in perceptions of product value.
May 22, 2025
-
U.S. Auto Parts & Powertrain Warranty Expenses: The auto parts manufacturers set new record highs for total warranty claims paid and reserves held in 2024. Within the industry, the subset of powertrain manufacturers tend to have higher warranty expense rates, since they generally have more direct contact with the end-user, compared to tier one and tier two suppliers.
May 8, 2025
-
U.S. Truck, Bus, & Heavy Equipment Warranty Expenses: The industry set a new record high for total warranty claims paid in 2024, for the second year in a row, while total accruals made and reserves held both decreased from 2023. Paccar saw claims costs rise by 45%, a year after it nearly doubled its warranty accruals.
May 1, 2025


-
HomeAssure Administration launches monthly home warranty service.
Press Release, Jul 3, 2025
-
Tefcold UK commercial refrigerators get 2-yr. parts warranty.
Cooling Post, Jul 2, 2025
-
Evolution Warranties to launch admin service for dealers.
Motor Trader (UK), Jul 2, 2025
-
ConsumerAffairs gives Endurance multiple Buyer's Choice Awards.
Press Release, Jul 1, 2025
-
MG requires dealer servicing for owners to get 10-yr. warranty.
Drive (AU), Jul 1, 2025
-
LKQ Euro Car Parts partners with Warranty Solutions Group.
Motor Trade News (UK), Jun 30, 2025
-
Yanmar launches new extended warranty program.
Landscape Management, Jun 30, 2025
-
InVita says WarrantyTracker software now used by 100 hospitals.
Press Release, Jun 26, 2025
-
Toco Warranty uses VectorSolv platform to enter home warranty market.
Press Release, Jun 25, 2025
-
Warranty management startup Mahalo adds $2.6m in pre-seed funding.
Press Release, Jun 25, 2025
-
Warranty Solutions Group & Genome Design launch Porsche warranty program.
Motor Finance Online (UK), Jun 25, 2025
-
American Home Shield offers 50% discounts to new clients through July 8.
Press Release, Jun 24, 2025
-
First Senior Group launches extended warranties for wheelchairs.
THIIS Magazine (UK), Jun 23, 2025
-
The longest electric car battery warranties in 2025.
Drive (AU), Jun 22, 2025
-
Warranty Solutions Group says alternators cause most van claims.
Business Vans (UK), Jun 20, 2025
Worldwide Heavy Equipment Warranty Report:
In 2023, the worldwide heavy equipment industry paid $4.6 billion in warranty claims, and set aside $6.6 billion in warranty accruals. The average claims rate was 1.17%, and the average accrual rate was 1.4%.
While the warranties issued for passenger cars and light trucks get all the attention, there is a huge warranty chain management operation on the commercial side, for the heavy equipment used in industries including construction, agriculture, and mining.
We're tracking the top 57 heavy equipment manufacturers worldwide, of which 23 include their warranty expense figures in their annual reports. Together, we estimate, these 23 OEMs accounted for about 83% of the worldwide heavy equipment industry's warranty expenses last year. So it's relatively easy to fashion estimates for the remaining 17%, and to create a report on their global warranty expenses.
Worldwide Auto Warranty Report:
In 2023, the global automotive manufacturers paid $51 billion in warranty claims, with an average claims rate of 1.98%, and set aside $65 billion in warranty accruals, with an average accrual rate of 2.52%. At the end of 2023, the worldwide automakers held a total of $140 billion in warranty reserves.
In 2023, the global automotive industry saw significant increases in three of our five key warranty metrics: claims paid, accruals made, and reserves held. Global automotive product warranty claims paid and accruals made both grew by 17% from 2022 to 2023, while warranty reserves held by global automotive manufacturers increased by 14%. At the same time, the industry average claims and accrual rates increased only slightly, meaning vehicle sales revenue grew parallel to increases in warranty costs.
Warranty Week tracks the warranty expenses of 34 major automotive manufacturers around the world, which report some or all of their warranty metrics to investors in their annual reports. Most report the amount they pay in claims, the amount of accruals they make, and the end-balance of the warranty reserve fund.
Twenty-first Annual Product Warranty Report:
Total warranty claims, accruals, and reserves increased among the U.S.-based manufacturers during 2023. Inflation has driven up the price of everything, including warranty work, but we see clear delineations among industry sectors. The vehicle and building trades sectors are seeing warranty costs grow, while the high tech sector is seeing a decline.
All but a small handful of late reporters have published their 2023 annual reports. In March, we presented the Top 100 Warranty Providers of 2023, and some information about the biggest increases and reductions in the warranty claims rates, accrual rates, and reserve balances among those largest manufacturers.
This week, we're presenting our Twenty-first Annual Product Warranty Report, based on the detailed warranty expense information we've been gathering since 2003. This year, we increased the number of companies included in this report, including many manufacturers that are new to reporting their warranty expenses. This year's report includes data from over 1,400 manufacturers that have reported product warranty expenses over the past two decades.
World's Largest Warranty Problems:
On the one hand, U.S.-based manufacturers are required to disclose their warranty expenses to investors. On the other hand, they try their best to obscure the news and bury it in plain sight when something really expensive happens. But as the saying goes, a picture's worth a thousand words. And in the charts that follow, it's hard to hide a billion-dollar warranty problem.
Over the past few years, every once in a while, a set of warranty expense numbers comes in that makes us wonder if there's been a typographical error in a company's annual report. Suddenly, there's a billion-dollar warranty expense and there's no explanation at all anywhere in the document.
Other times, a major safety recall or some other big event makes the news, and inevitably it gets reduced into a major escalation in a company's warranty expenses. For these, we don't need any additional explanations, but we never do find out exactly how much it costs.
Warranty Expenses When Conglomerates Break Up:
In early 2020, two diversified companies spun off product lines to become "pure plays" in specific industries. And now, seven quarters later, the warranty expense metrics of the five new companies, which were previously blended together, have diverged in very distinct ways.
After news broke last month about the plans of General Electric Company and Johnson & Johnson to break themselves into three and two companies, respectively, it made us recall the break-ups of last year, when United Technologies Corp. and Ingersoll-Rand plc reorganized themselves into three and two units.
As we wrote about in the May 28, 2020 newsletter, our main interest in the break-ups of these conglomerates was how their subsequent financial statements would allow us to get a much clearer view of their warranty expenses, since the aerospace claims and accruals would no longer be blended with those of the air conditioning or industrial/building products lines of business. And now, with nearly two years of separate data in hand, that clearer picture has emerged.
The A-Team of Extended Warranties:
Ten companies, whose names all begin with the letter A, control at least 57% of the $40 billion U.S.-based and consumer-facing service contract industry. Most are administrators and/or underwriters of the protection plans, but a few are electronics manufacturers and/or retailers.
Extended warranties are a huge business in the U.S. Last year, consumers spent an estimated $17 billion on vehicle service contracts, and roughly $23 billion on protection plans for their appliances, electronics, computers, and mobile phones.
A huge chunk of that money is going to the people that sell them: the dealers and retailers who collect very healthy sales commissions and move on. But the rest is going to a long list of service contract administrators and insurance underwriters who seem to retain the risk and do all the work.
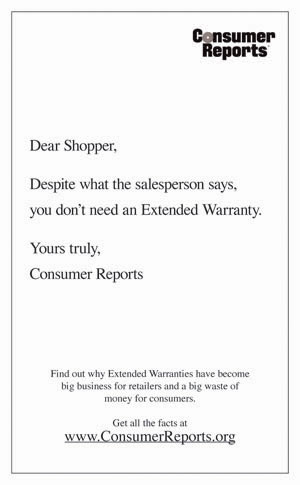
Consumer Reports' 2006 Extended Warranty Ad:
There was panic in the industry when one of the most trusted consumer advocates told its readers not to buy extended warranties. Ten years later, the magazine's advice is almost forgotten, and the industry is bigger than ever.
In a few weeks we'll be marking a very important anniversary in the service contract industry. Just as the holiday shopping season of 2006 was getting under way, a major consumer product ratings publisher told shoppers that extended warranties were a waste of money. On Tuesday morning, November 14, 2006, the USA Today newspaper carried on the back page of the "Money" section (page 10B), the following full-page ad placed by Consumer Reports magazine:
Reaction was swift. Some said both the frequency of breakdowns and the average cost of repair was higher than Consumer Reports was calculating, making service contracts a better value than was admitted. Others said it was simply a matter of price, in that nobody would deny the value of a service contract priced at 0% of the product's price (in other words, free).
VW's Emissions Warranty Scandal:
Some students cheat on tests. But companies rarely do, because the cost of getting caught is very high. And in the long run, someone usually snitches. So isn't it ironic that a bunch of students caught one of the world's largest manufacturers cheating on a test?
At Volkswagen AG, the world's largest passenger car manufacturer, and the world's largest warranty provider, with some of the industry's highest warranty expense rates, things just went from bad to worst. The company, which spent 7 billion euro (US$7.9 billion) last year on warranty claims, could end up paying an additional US$3.6 billion in claims and fines to fix a major problem with almost half a million diesel cars that have been found to be illegally polluting the air.
It all started last May, when the International Council on Clean Transportation, a small nonprofit organization focused on the reduction of vehicle emissions, and a research team at the Center for Alternative Fuels Engines and Emissions within West Virginia University, documented the discrepancy between test levels and real world nitrogen oxide (NOx) emissions levels from new passenger cars equipped with diesel engines.


Privacy Policy, GDPR guidelines & Cookie Policy
** DOES NOT DISCLOSE YOUR PERSONAL INFORMATION**
to outside parties UNDER ANY CIRCUMSTANCES.
Periodically, aggregate statistics will be provided to our advertising partners, but no specfic or personal information will be included. We do ask you if you are interested in receiving relevant information or offers from warranty vendors via email. You may choose to receive this information or easily "unsubscribe" and choose NOT TO RECEIVE any emails from Warranty Week outside of your newsletter subscription.
🔶 If you choose to receive additional information other than your newsletter, this information is sent to you directly by Warranty Week. If you choose not to receive other information from us, this WILL NOT AFFECT your regular subscription. If you choose to discontinue your newsletter subscription, you may also do this by simply unsubscribing at any time. When you send us your "unsubscribe" request to each of our offerings, YOUR RECORD GETS PERMANENTLY REMOVED from these databases as we receive your remove requests.
🔶 Thank you for making Warranty Week the Web's premier resource for warranty professionals and please let us know how we can serve you better!
🔶 What information do we collect?
🔷 We collect information from you when you subscribe to our newsletter.
🔶 What do we use your information for?
🔷 Any of the information we collect from you may be used in one of the following ways:
To send our weekly newsletter.
"Your information, whether public or private, will not be sold, exchanged, transferred, or given to any other company for any reason whatsoever, without your consent, other than for the express purpose of
delivering the purchased product or service requested."
🔶 Do we use cookies?
🔷 As per our Cookie Policy (bottom accordion tab) our system requires the use of certain cookies to function. We also have optional cookies you may opt-in or opt-out of using.
🔶 Do we disclose any information to outside parties?
🔷 We do not sell, trade, or otherwise transfer to outside parties your personally identifiable information. This does not include trusted third parties who assist us in operating our website, conducting our business, or servicing you, so long as those parties agree to keep this information confidential. We may also release your information when we believe release is appropriate to comply with the law, enforce our site policies, or protect ours or others rights, property, or safety. However, non-personally identifiable visitor information may be provided to other parties for marketing, advertising, or other uses.
🔶 GDPR Compliance
🔷 We are in compliance The European Union’s General Data Protection Regulation (G.D.P.R.) laws which are meant to ensure a common set of data rights in the European Union. (see lower accordion tab)
🔶 California Online Privacy Protection Act Compliance
🔷 Because we value your privacy we have taken the necessary precautions to be in compliance with the California Online Privacy Protection Act. We therefore will not distribute your personal information to outside parties without your consent.
🔶 Children's Online Privacy Protection Act Compliance
🔷 We are in compliance with the requirements of COPPA (Children Online Privacy Protection Act), we do not collect any information from anyone under 13 years of age.
Our website, products and services are all directed to people who are at least 13 years old or older.
🔶 Your Consent
🔷 By using our site, you consent to our web site privacy policy.
🔶 Changes to our Privacy Policy
🔵 If we decide to change our privacy policy, we will post those changes on this page.
🔶 Contacting Us
🔷 If there are any questions regarding this privacy policy you may contact us using the information below.
Warranty Week Home Page
10520 66th Road
Forest Hills, NY 11375-2179
USA
📧 Editor
📅 Last Updated: December 12, 2024
This Data Protection Notice explains how we collect and use your personal information. Please read this notice carefully to understand our practices.
🔶 Information We Collect ‐ We may collect the following personal information about you:
- 🔹 Email address
- 🔹 IP address
- 🔹 Other information you provide through our website or contact forms
🔶 How We Use Your Information ‐ We may use your personal information for the following purposes:
- 🔹 To respond to your inquiries or requests
- 🔹 To provide you with information about our products or services
- 🔹 To improve our website and services
- 🔹 To comply with legal requirements
🔶 Your Rights ‐ You have the following rights under the General Data Protection Regulation (GDPR):
- 🔹 Access: You have the right to request a copy of the personal information we hold about you.
- 🔹 Rectification: You have the right to request that we correct any inaccurate or incomplete personal information.
- 🔹 Erasure: You have the right to request that we delete your personal information.
- 🔹 Restriction: You have the right to request that we restrict the processing of your personal information.
- 🔹 Data portability: You have the right to request that we transfer your personal information to another organization.
- 🔹 Object: You have the right to object to the processing of your personal information.
🔶 How to Exercise Your Rights
🔷 To exercise any of your rights, please contact us using the information provided below.
🔶 Contact Information: 📧 Editor
🔶 Changes to This Notice
🔵 We may update this Data Protection Notice from time to time. Any changes will be posted on this page.
📅 Last Updated: December 12, 2024
- 🔹 Essential Cookies: These must be enabled for the site to function correctly.
- 🔹 Optional Cookies: These control opt-in or opt-out of certain enhancements to the site.
📅 Last Updated: December 12, 2024
Contributors
Articles submitted to Warranty Week should address issues of importance to managers in manufacturing industries such as automobiles, trucks, consumer electronics, and home appliances that traditionally provide basic manufacturers' warranties with their products. More specifically, the articles should point out ways of improving the management of warranty programs, reducing warranty program cost, raising quality levels, reducing defect rates, improving response time, reducing warranty fraud, etc. If there is a common thread we look for, it would be the application of computer technology to the improvement of the warranty management process.
Through both a weekly email broadcast (over 7,000 recipients as of December 2017) and an online Web site (averaging upwards of 19,000 page requests per week), Warranty Week reaches an educated audience of thousands of warranty professionals worldwide. Most of this diverse and dispersed group of people are involved in warranty processing, from upper level (CEO, CIO, VP, GM) to middle-level positions (plant managers, department heads, engineers and consultants) in a vast cross section of manufacturers, dealers, retailers, third party plan administrators, insurance companies, software developers, and investors. What they have in common is a professional interest in the warranty process, from the assembly line to the consumer's home. Consumers are not a major part of the readership, although fleet managers in the airline, trucking, and metropolitan transportation fields are.
Success stories are welcome, but failures can teach others valuable lessons, too. Don't overlook the negative side-effects of warranty process automation -- unemployment, cost overruns, obsolete equipment caused by changes in the market -- but try to find the positive lessons for managers faced with similar situations.
Manuscript Requirements
Copy must be submitted in an electronic format. A plain text document in the body of an email message is best, but a Word document is also acceptable. The problem is that Word is quite hostile to HTML reformatting, in spite of the built-in converter. However, if photos or diagrams are part of the presentation, then a Word version can serve as a handy guide during the reformatting. Authors are strongly encouraged to add hyperlinks to their copy, in lieu of footnotes, sidebars, or extensive background explanations. Let's make use of the medium, and link as much as we can. However, keep in mind that the copy will end up incorporated into a pre-existing Web page as a 500-pixel-wide column, so advanced HTML formatting (style sheets, frames, JavaScript, etc.) is not advisable. It may interfere with the rest of the page (this is the biggest problem with the built-in Word-to-HTML reformatter: it assumes it is the page, not an insert into an existing page).
Charts and tables are strongly encouraged, but direct conversions from Excel to HTML are also troublesome, especially if there are multiple tables to be converted. It's the same problem: Excel reformats charts in a way that interferes with existing formatting of the rest of the page. Charts and graphics delivered in a JPEG, GIF, Bitmap, or PowerPoint format are best, but tables built in Excel can also be manually converted into HTML, as long as they're not overly complex. Please place all photos, graphics, charts, and diagrams in a separate folder. Line width should be 65-70 characters, left-justified. No handwritten manuscripts, please.
Manuscript length is determined by the value of your words. Don't pad out a story with more words than are necessary to make your point, but don't cut out important concepts or ideas to make space. Let us decide what to cut, if that becomes necessary, to fit our available space. Also keep in mind that extensive amounts of background material can be posted separately on second or third pages, with "see also" hyperlinks added to the body of the main piece. We encourage the inclusion of hotlinks to pre-existing white papers, press releases, news articles, slide shows, and other supplemental materials, especially as contact options.
Please include a short biography of the author(s) at the end. It need not be long or detailed. Three or four sentences is just fine. The goal is to provide the reader with both a brief background about the author(s) and a way to contact them with questions or comments. And don't forget to include a headshot photo!
The three main categories of articles we seek are:
- Concept/theory -- approximately 2,000-3,000 words
- Applications -- approximately 700-1,500 words
- Case studies -- approximately 1,500-2,000 words
Art Requirements
Photos, charts, graphs, drawings, and other artwork should be sent in an electronic file format, preferably in a JPEG, GIF, or Bitmap format. Headshots should be at least 140 x 210 pixels (w x h) in size, and in an approximately 2:3 aspect ratio. Logos, clip art, and other design elements can be any size or aspect ratio, although anything wider than 480 pixels may need to be reduced in size to fit the available column width. If there are extra-large graphics or diagrams, we'll put a smaller 480-pixel-wide hotlinked version of it into the newsletter with instructions to "click here to see full-size version." Please include a credit line for the source of a graphic if other than the author.
Rights
All articles must be original and must not have been previously published elsewhere. Warranty Week will encourage others to hotlink to the online version of the newsletter, and we will provide a package of logos, graphics, and HTML code to help a Webmaster accomplish this. We also encourage the inclusion of hyperlinks directing readers to the authors' bio, business and personal Web sites, and contact information. We also will provide authors with at least one copy of the HTML email edition of the article, which they are then free to forward and rebroadcast in its entirety to others. But the copyright will remain with Warranty Week.
Light and Dark Theme
Click to toggle the mode to your preference