In our 22nd Year of providing first rate Warranty Information!
-
U.S. Small Vehicle Warranty Expenses: Ford, GM, and Tesla are not the only small vehicle manufacturers based in the U.S., though they do account for the lion's share of the industry's warranty expenses. This week, we delve into the warranty expenses of the other manufacturers in the industry, including manufacturers of motorcycles, boats, EVs, riding lawn mowers, street sweepers, and more.
April 25, 2024
-
Twenty-first Annual Product Warranty Report: Total warranty claims, accruals, and reserves increased among the U.S.-based manufacturers during 2023. Inflation has driven up the price of everything, including warranty work, but we see clear delineations among industry sectors. The vehicle and building trades sectors are seeing warranty costs grow, while the high tech sector is seeing a decline.
April 18, 2024
-
Warranty Consulting: The Marsh warranty practice helps companies looking to launch protection programs do it right the first time.
April 11, 2024
-
Top 100 Warranty Providers of 2023: About two-thirds of the top 100 U.S.-based warranty providers increased their warranty claims rate, accrual rate, and reserve balance in 2023. These unprecedented increases are mainly due to inflation, rather than huge rates of recalls or product failures. But a few companies did stand out as big winners and big losers in 2023, in the form of large increases and reductions in these three warranty metrics, compared to themselves in 2022.
March 21, 2024
-
Site-Built New Home Warranty Report: Total warranty claims, accruals, and reserves continue to rise for the site-built new home industry. Some companies are struggling to predict their warranty costs and set aside a steady amount per home sold, while others are incredibly consistent.
March 14, 2024

-
Home warranty firm that sent convicted felon into local homes hard to reach.
WAVY-TV Portsmouth VA, April 25, 2024
-
World Diamond Council's revised System of Warranties to take effect Sept. 21.
Mining Weekly, April 24, 2024
-
How much is a home warranty per month, per year & per service call?
CNN, April 24, 2024
-
EU's new right-to-repair rules extend product warranties 1-yr. after repairs.
The Verge, April 23, 2024
-
Transformco has trouble replacing 20-yr.-old washer still on Sears extended warranty.
NJ Advance Media, April 23, 2024
-
ROG Ally handheld gaming PC's SD card reader gets extra year's warranty in US only.
PC Gamer, April 22, 2024
-
Cease-and-desist order issued against Choice Home Warranty in Georgia.
The Georgia Virtue, April 20, 2024
-
Here's what you should know about EV warranties.
Digital Trends, April 20, 2024
-
Dodge introduces the Complete Performance Vehicle Protection Package.
Press Release, April 18, 2024
-
arShield won't replace engine, blaming previous repair job for failure.
KSL-TV Salt Lake City UT, April 18, 2024
-
Extended warranty startup Upsie is acquired by Akko.
FinTech Global, April 17, 2024
-
Toco Warranty wins the Grand Stevie Award for Sales & Customer Service.
Press Release, April 17, 2024
-
Dacia conditions 7-yr. warranty extension on annual servicing.
This Is Money (UK), April 16, 2024
-
Lippert Components promotes Pamela VanderMel to VP of Warranty.
RV Business, April 16, 2024
-
2-10 HBW claims data finds average of 10 post-closing items per new home.
Press Release, April 16, 2024
World's Largest Warranty Problems:
On the one hand, U.S.-based manufacturers are required to disclose their warranty expenses to investors. On the other hand, they try their best to obscure the news and bury it in plain sight when something really expensive happens. But as the saying goes, a picture's worth a thousand words. And in the charts that follow, it's hard to hide a billion-dollar warranty problem.
Over the past few years, every once in a while, a set of warranty expense numbers comes in that makes us wonder if there's been a typographical error in a company's annual report. Suddenly, there's a billion-dollar warranty expense and there's no explanation at all anywhere in the document.
Other times, a major safety recall or some other big event makes the news, and inevitably it gets reduced into a major escalation in a company's warranty expenses. For these, we don't need any additional explanations, but we never do find out exactly how much it costs.
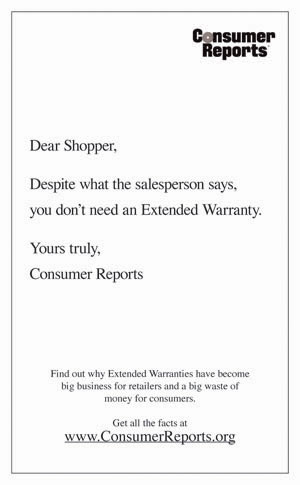
Consumer Reports' 2006 Extended Warranty Ad:
There was panic in the industry when one of the most trusted consumer advocates told its readers not to buy extended warranties. Ten years later, the magazine's advice is almost forgotten, and the industry is bigger than ever.
In a few weeks we'll be marking a very important anniversary in the service contract industry. Just as the holiday shopping season of 2006 was getting under way, a major consumer product ratings publisher told shoppers that extended warranties were a waste of money. On Tuesday morning, November 14, 2006, the USA Today newspaper carried on the back page of the "Money" section (page 10B), the following full-page ad placed by Consumer Reports magazine:
Reaction was swift. Some said both the frequency of breakdowns and the average cost of repair was higher than Consumer Reports was calculating, making service contracts a better value than was admitted. Others said it was simply a matter of price, in that nobody would deny the value of a service contract priced at 0% of the product's price (in other words, free).
VW's Emissions Warranty Scandal:
Some students cheat on tests. But companies rarely do, because the cost of getting caught is very high. And in the long run, someone usually snitches. So isn't it ironic that a bunch of students caught one of the world's largest manufacturers cheating on a test?
At Volkswagen AG, the world's largest passenger car manufacturer, and the world's largest warranty provider, with some of the industry's highest warranty expense rates, things just went from bad to worst. The company, which spent 7 billion euro (US$7.9 billion) last year on warranty claims, could end up paying an additional US$3.6 billion in claims and fines to fix a major problem with almost half a million diesel cars that have been found to be illegally polluting the air.
It all started last May, when the International Council on Clean Transportation, a small nonprofit organization focused on the reduction of vehicle emissions, and a research team at the Center for Alternative Fuels Engines and Emissions within West Virginia University, documented the discrepancy between test levels and real world nitrogen oxide (NOx) emissions levels from new passenger cars equipped with diesel engines.
Warranty Expenses When Conglomerates Break Up:
In early 2020, two diversified companies spun off product lines to become "pure plays" in specific industries. And now, seven quarters later, the warranty expense metrics of the five new companies, which were previously blended together, have diverged in very distinct ways.
After news broke last month about the plans of General Electric Company and Johnson & Johnson to break themselves into three and two companies, respectively, it made us recall the break-ups of last year, when United Technologies Corp. and Ingersoll-Rand plc reorganized themselves into three and two units.
As we wrote about in the May 28, 2020 newsletter, our main interest in the break-ups of these conglomerates was how their subsequent financial statements would allow us to get a much clearer view of their warranty expenses, since the aerospace claims and accruals would no longer be blended with those of the air conditioning or industrial/building products lines of business. And now, with nearly two years of separate data in hand, that clearer picture has emerged.
The A-Team of Extended Warranties:
Ten companies, whose names all begin with the letter A, control at least 57% of the $40 billion U.S.-based and consumer-facing service contract industry. Most are administrators and/or underwriters of the protection plans, but a few are electronics manufacturers and/or retailers.
Extended warranties are a huge business in the U.S. Last year, consumers spent an estimated $17 billion on vehicle service contracts, and roughly $23 billion on protection plans for their appliances, electronics, computers, and mobile phones.
A huge chunk of that money is going to the people that sell them: the dealers and retailers who collect very healthy sales commissions and move on. But the rest is going to a long list of service contract administrators and insurance underwriters who seem to retain the risk and do all the work.