Industry Segments:
Year to year, each industry's overall share of warranty claims changes slowly, as do their individual claims rates as a percentage of sales. But because many companies operate in more than one industry, precise calculations are elusive.
One of the greatest impediments to making an accurate allocation of all product warranty expenditures by industry is the simple fact that many companies simply won't fit neatly into one single industry category. Most modern automobiles contain both computers and air conditioning equipment. Several of the leading air conditioning manufacturers also are leaders in aerospace. Some of the largest automotive manufacturers are making vehicles for use on lawns, farms, mines, and construction sites.
The Standard Industrial Codes are little help. SIC 3510, for "engines & turbines," contains not only the lawn mower company Briggs & Stratton Corp., but also Brunswick Corp., makers of boat engines and sports equipment, not to mention Cummins Inc., a leading diesel engine manufacturer. Toolmaker Black & Decker Corp. is over in SIC 3540 for "metalworking machinery and equipment," along with TV tower manufacturer SPX Corp. Telecom and semiconductor manufacturer Motorola Inc. is in the same SIC as avionics manufacturer Rockwell Collins Inc.
No Warranty Segment Data
Many manufacturers quite carefully chop up their sales revenue by product type. But none chop up their warranty expenses at all. Of the 861 U.S.-based manufacturers tracked by Warranty Week, not one provides any segmenting data of their warranty claims or accruals by product line, division, or industry.
Given these facts, virtually anything we attempt to do in the realm of warranty by industry is going to be wrong. The question is how wrong. Either we're going to arbitrarily chop up a company's warranty expenses as if they arise proportionally to revenue, or we're going to arbitrarily exclude some companies from multiple industries they're most definitely in. We chose the latter as the lesser of two wrongs.
For this, the final installment of the analysis of first quarter 2004 warranty claims and accruals, we tried to put every manufacturer into one and only one industry category. It was a question of where they fit best. Then we took a total of warranty claims for all companies in a given category, and compared these figures to overall revenue to compute a claims rate for each industry.
For the purposes of these few charts only, we removed Motorola and Honeywell from the auto parts category but kept them in the telecom and semiconductor sectors; removed American Standard Companies Inc. from auto parts but kept it in the HVAC, building materials, and appliance sectors. Honeywell also was removed from the HVAC category. Eaton was removed from HVAC but remained in auto parts. General Electric was counted in only the power equipment industry, the stated source of most of its warranty claims. Ingersoll-Rand Co. Ltd., makers of refrigerated truck trailers, remained as an auto OEM but was removed from HVAC. Some of these modifications involved somewhat arbitrary choices about which is now their "core" industry. For Motorola, founded as a maker of car radios, and for Honeywell, best-known for its ubiquitous thermostats, this was a difficult choice. But remember, the goal was to minimize double-counting.
Overlapping Industries
The recreation vehicle category -- where warranty provision is led by Fleetwood Enterprises Inc. and Thor Industries Inc. -- was found to overlap excessively with the automotive OEM and parts categories. So although we tabulated the $56.9 million in first quarter 2004 RV warranty claims, this sector was not included in the overall pie charts. It was the same story for mining equipment, as led by Terex Corp. and NACCO Industries Inc.; for farm equipment, as led by Caterpillar Inc., Deere & Co., and AGCO Corp.; and for security equipment, led by Tyco International Ltd., Rockwell Collins Inc., General Dynamics Corp., and NCR Corp.
Each of these companies is included in the aerospace, telecom, and/or auto OEM and parts categories, as appropriate, making the categories for farm equipment, mining equipment, and security equipment overly duplicative. Therefore, these four industry sectors were dropped from the pie charts.
For the record, here are the first-quarter 2003 and 2004 totals for warranty claims by vendors either partially or entirely within those industries:
| Industry Sector | 1Q03 Claims | 1Q04 Claims |
| Farm Equipment | $291m | $316m |
| Mining Equipment | $52.5m | $65.5m |
| Recreational Vehicles | $55.7m | $56.9m |
| Security Equipment | $354m | $341m |
The consumer electronics category remains problematic. Because many of the top Japanese, Korean, and European companies that dominate this industry do not report any warranty figures at all, most of the big names are missing from the list. Many of those who remain are American computer companies already counted elsewhere, which are now dabbling in CE sectors such as MP3 music players, big screen TVs, and digital cameras. For these reasons, the entire category is a mix of under-counting and double-counting, and the results are at best misleading. Further research is needed before we can make any educated guess regarding warranty claims in the consumer electronics sector.
In the past week, another 12 manufacturing companies have filed their first quarter 2004 financial statements with the U.S. Securities and Exchange Commission. This brings the overall total of fully-reporting warranty-issuing manufacturers up to 697; partially-reporting companies up to 47; non-reporting companies up to 79; past-deadline companies up to 20; and yet-to-report companies up to 18, for a total of 861 warranty-issuing manufacturers. If anything should change in the weeks ahead, the online versions of this most recent batch of Warranty Week columns will be modified accordingly.
Double-Counting
Large manufacturing companies remaining in multiple categories, and therefore double-counted, include American Standard Companies Inc., Caterpillar, Cummins, Maytag, United Technologies, and Whirlpool. Unlike many of those eliminated from one or more categories, these companies really do have multiple core product lines that cross industry lines. For instance, Cummins and Caterpillar sell diesel power generators as well as truck motors. American Standard is big in both plumbing and air conditioning (Trane). United Technologies makes jet engines (Pratt & Whitney), helicopters (Sikorsky), avionics (Hamilton Sundstrand), elevators (Otis), and air conditioners (Carrier). The total effect of these double-counts inflated overall warranty claims by approximately 10%. Therefore, please consider the market "shares" for each industry to be approximate.
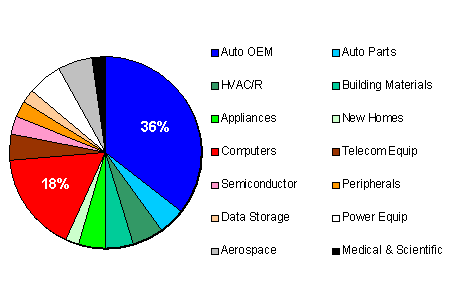
During the first quarter of 2004, total warranty expenditures topped $5.9 billion. Allowing for double-counting, Warranty Week estimates that approximately 40% was automotive; 29% was information technology; 17% was house and home-related, and the remainder was "other". Split further, as in the pie chart below, the automotive sector (blue) was made up of OEMs and parts/components suppliers; the IT sector (red) was split into computers, peripherals, data storage, telecom/datacom, and semiconductors; the home-related sector (green) was split into new homes, HVAC, building materials, and home appliances; and the "other" sectors (black and white) included power equipment, aerospace, and medical and scientific equipment.
Figure 1
Warranty Claims
by Industry
First Quarter 2004
Source: Warranty Week
Click on the chart to see a larger image of the pie.
As can be seen in the above pie chart, warranty claims in the blue sections were dominated by the claims of automotive OEMs -- final vehicle assemblers such as GM and Ford. Likewise, the reddish sections were dominated by the computer OEMs -- home of Dell, IBM, HP, Apple, and others. Speculation about why their shares are so outsized was discussed more completely in the June 2 edition of Warranty Week. Meanwhile, in the greenish sections, the shares are somewhat more evenly split between new homes, appliances, HVAC/R, and building materials.
Readers of the Plain Text Edition of Warranty Week are encouraged to find a Web browser with which to view the online pie charts at http://www.warrantyweek.com/newsarchive/ww20040622.html
Warranty Market Shares
A year ago, during the first quarter of 2003, total warranty expenditures were just under $5.8 billion. Allowing for double-counting, Warranty Week estimates that approximately 39% was automotive; 30% was information technology; 17% was house and home-related, and the remainder was "other". Within the 14 sub-categories, the "shares" were more or less the same as earlier this year, although both auto OEM and computer OEM did change by just less than a full percentage point each. The telecom/datacom sector was the only other industry in which the overall share of warranty claims changed by a significant amount (-0.5%).
Figure 2
Warranty Claims
by Industry
First Quarter 2003
Source: Warranty Week
Click on the chart to see a larger image of the pie.
Not surprisingly, the two pie charts look very similar, except for those slight percentage changes for automotive and computer OEMs. Given the large number of manufacturers behind each of these slices, it takes a massive move in the same direction by several major players to change the percentages by much. However, for every United Technologies or Lucent Technologies that turns in a plunging claims report, there are usually a few others who see their claims rise. Things change slowly across entire industries.
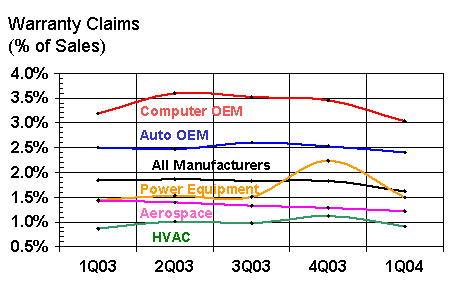
As mentioned in the June 15 column, the trend lately has been decidedly downwards. Warranty claims in the first quarter of 2004 fell both in sheer dollars and in percent of sales terms. After remaining nearly level all of last year at around 1.8% of sales, claims suddenly took a dive to 1.6% of sales in the first three months of 2004.
It turns out that claims fell in numerous industries. We showed you the automotive OEM sector last week, and we'll show you the next four largest this week: computer OEMs, HVAC/R, aerospace, and power equipment. Together, these five industry sectors account for almost 70% of all warranty claims, as shown in the pie charts above. So it's no surprise that if claims fell overall, they also fell in each of these five sectors.
Figure 3
Warranty Claims
in Five Industries
1Q 2003 to 1Q 2004
Source: Warranty Week
Click on the chart to see a larger image.
Of the five largest warranty industry sectors, only HVAC/R and electrical power equipment saw their claims rates rise from a year ago, and both of those sectors also showed declines from the fourth quarter of 2003 to the first quarter of 2004. In fact, both HVAC and power equipment saw seemingly one-time bumps upward in their rates during the fourth quarter. They are both now back to what seems to be a more normal range.
Automotive OEMs are the most stable, with their claims rates rising or falling by only slight amounts each quarter. Computer OEMs and power equipment vendors are the most volatile, as evidenced by the curvature of the red and orange lines in the chart above. By the way, we had to alter the color code a bit in Figure 3, because white and gray don't show up very well on a white background. But basically, this is the same data expressed in a different way -- as a percentage of sales rather than as a percentage of all claims.
Numerous readers have written in over the past several weeks to offer opinions about why the charts became somewhat erratic during the first quarter of 2004. Some said it was indeed a seasonal fluctuation. Others suggested that warranty accounting practices are themselves somewhat seasonal, with accountants forcing every last expense onto the books before the fiscal year closes and leaving the first quarter of the next fiscal year somewhat fallow as a result. Most agree that whatever the cause, more data would help. This is the conclusion of the first year-over-year comparison of warranty claims and accruals. With a few more quarters of data and a few more years to compare, it will become much more apparent what the trends and causes are behind these fluctuations.


