Warranty Seminar:
Last month, a business intelligence software developer sponsored a morning seminar on the topic of the TREAD Act and warranty claims. For those who couldn't make it, here's a brief overview of the proceedings.
In Long Beach, California last month, across the bay from the berth of the Queen Mary, InfoGain Corp. hosted a half-day seminar on the topic of the TREAD Act and warranty data. Your editor attended as both a speaker and as a reporter, so what follows is an attempt to be both participant and observer at the same time.
The Transportation Recall Enhancement, Accountability and Documentation Act, passed into law four years ago during the waning days of the Clinton administration, outlined reporting requirements for automotive manufacturers that have fully come into force in only the past half-year. Historical reports covering the years 2000 to 2003 were due by Jan. 15 of this year. In a few weeks, the deadline for what will be the fourth consecutive quarter of current reports will pass.
All four speakers at the InfoGain seminar said the system seems to be working, at least for a system just about to turn a year old. It's not a disaster, a bureaucratic nightmare, or a money pit, as some feared it would be. And despite the peculiar case of Mitsubishi, nobody has yet been led off to jail for violations of the new law.
The Legal Viewpoint
Kristi L. Anderson of Semmes, Bowen & Semmes, a Baltimore-based law firm, led off the morning seminar with a 45-minute overview from an attorney's point of view. She said that at this early date in the history of TREAD reports, NHTSA is pursuing enforcement and compliance issues with what she called a "gentle hand." Penalties top out at $15 million in civil fines and 15 years in prison for criminal behavior, she said, but so far nobody has suffered such a fate.
"NHTSA is going to be flexible at this point as they work with manufacturers," she said. "So they'll be taking a gentle hand in dealing with anything that arises." What they're looking for, she said, is a good faith effort by manufacturers to file the reports on time, with as much data in them as is available. For instance, the agency doesn't want to see an unusual amount of entries in the "other" columns, which suggests a manufacturer can't or won't be more specific. It expects follow-up reports that update missing or unavailable data, such as VIN numbers or suspected causes of accidents or failures.
She said from what she's heard from people at NHTSA, compliance has been very high so far. "The word that I got is that they are pleasantly surprised."
Anderson said she's less sure if they're yet able to do all they want to with the data they receive. It is still early days, although the early signs appear to be positive. In the near future, she said some accident investigations will be driven by TREAD data. So far, that hasn't happened. NHTSA is at the point where they will begin delving into the data for its substantive value, she noted. However, numerous times already, NHTSA has backed up recall announcements with specific data points, which they identify as being unusually high. But Anderson said she suspects they're really only scratching the surface so far.
Anderson spotlighted one reporting problem in her presentation arising from the importation of foreign-made automobiles with the tires already on them. The tire manufacturers, based abroad, were being asked to trace their own products through the OEMs and dealers, and they simply didn't know which vehicles have which tires from which production run. So they don't know what data to report to NHTSA.
Anderson outlined for the audience what elements of TREAD reports will and will not remain confidential. Information that will automatically be deemed confidential includes:
- Production numbers (except for light vehicles)
- Warranty claims
- Field reports
- Consumer complaints
- Blueprints and engineering drawings
- Future specific model plans (until the first model is offered for sale)
- Future vehicle production or sales figures for specific models (until the applicable model year production period ends)
Information that will not remain confidential includes:
- Claims and notices relating to injuries
- Claims and notices relating to fatalities
- Claims and notices relating to property damage
To get information from NHTSA, Anderson said she simply calls them. "Communication with NHTSA is the key," she said. "I mean, they're people just like we are. And they're very responsive when you call asking for information."
In general, she said she supports NHTSA's decision to treat warranty claims data as confidential business information. She's not sure if it could be misused by "ambulance chasers" in search of clients, and she's not even sure if released it would make its way into competitive advertisements (our cars have less failures, etc.). What she sees it becoming is a kind of quality tip sheet for OEMs, which they could use to compare another company's supplier failure rates to their own.
The Reporter's Viewpoint
Warranty Week editor Eric Arnum picked up on two of Anderson's themes: the disconnect of warranty matters between suppliers and OEMs, and the confidentiality of TREAD Act warranty data. As detailed in the April 13 and June 2 issues, there seems to be a massive difference between the warranty experience of the parts suppliers and the final vehicle assemblers.
For instance, in 2003 Ford spin-off and parts supplier Visteon Corp. had product revenues of approximately $17.66 billion. At $138.44 billion, the Ford Motor Co. had revenues roughly eight times larger. Visteon reported warranty claims of $17 million for the year. For reported more than 200 times as much: $3.52 billion. It's much the same story for General Motors and Delphi, and for the other OEMs and parts suppliers as a group.
Arnum provided two graphs to show this trend clearly. The first was a plot of four OEM groups: GM and Ford, bus manufacturers, recreational vehicle manufacturers, and heavy truck manufacturers. In the chart below, GM and Ford are in blue, the bus makers are in purple, the RV makers are in green, and the truck makers are in red.
Automotive OEM Warranty Claims Rates, 2003
Source: Warranty Week
As the chart shows, claims rates for automotive OEMs last year ranged from 2.97% for bus manufacturers in the first quarter to 2.1% for truck manufacturers in the second quarter. Let's round these off and conclude that anything between 2% and 3% is a "normal" claims rate for automotive OEMs based in the U.S. Anything above or below this range would be unusual, given the data.
Meanwhile, automotive suppliers as a group typically report claims rates 1/2 or even 1/3 as high as the OEMs they supply. Four groups were spotlighted. In the chart below, auto parts are portrayed in green, air conditioning is in purple, tires are in red, and Delphi and Visteon are in blue.
Automotive Component Warranty Claims Rates, 2003
Source: Warranty Week
The highest claims rate amongst them was 0.77% for auto air conditioning component makers in the fourth quarter, and the lowest came from Visteon and Delphi in the third quarter (0.15%). Again, let's round these off and suggest that anything between 0.2% and 0.8% is "normal" for the automotive parts and components suppliers.
Arnum suggested that part of the reason was the disconnect between suppliers and final vehicle manufacturers. It's easy to diagnose a parts failure. It's more difficult to conclude why a part failed, and harder still to figure out who made it, when, and where. Sometimes, by the time a cause is pinpointed, the parts in question are out of warranty. For while the OEMs like their four, seven, or even ten-year warranties, the suppliers usually stick with much shorter durations.
What was also interesting to note is that by its very name, the TREAD Act was going after Firestone and Ford, and their alleged supplier-OEM missed opportunities and failures to communicate. Yet tires as a product family have typical warranty claims rates in the 0.3% to 0.5% range. Because these are monetary percentages derived from claims divided by revenue, they can't be equated to units. So while it's incorrect to assume a range of three to five failures per thousand units, the correct figure is probably not far off.
Which brought Arnum to his second point: whether TREAD warranty data remains confidential or not is really not a very important question. For while we don't know the failure rate per thousand units, we do know the claims cost per thousand dollars, thanks to data filed with another federal agency, the Securities and Exchange Commission. With rather crude estimates of cost per unit and/or average cost per claim, one could construct some very rough estimates of the data that NHTSA knows in detail. And even though data for the importers is incomplete, enough exists for one to prove that indeed, the Japanese carmakers have lower claims rates than their U.S. peers.
The Customer Viewpoint
Jackie Magnuson of Kia Motors America spoke about the software the company licensed from InfoGain to help it meet the TREAD Act's reporting requirements. In general, she said, the software has improved the company's ability to analyze claims data and field reports, but it also has unleashed demand for additional data mining capabilities.
"It's a double-edge sword," she said. Yes, the installation of the InfoGain business intelligence system has helped the company better organize its internal data, but it also has created additional demands for even better data and even better ways of interpreting the data. Were it not for TREAD, Kia might have done it differently, and perhaps might have done it on a different timetable. So TREAD created the need and the deadline to meet, but it also is creating additional ongoing demands.
Magnuson said she agrees that so far NHTSA has pursued a "gentle hand" approach to enforcement. In Kia's case, the evidence of that approach has been the seeming success of its compliance efforts. The quarterly and historical reports have been submitted, and nobody from NHTSA has called to complain about the content or the format.
She said Kia bought into the premise that it wasn't the actual data in the quarterly spreadsheets that mattered as much as it was the defense and explanation of that data in response to requests for additional information. Kia is now able to complete and sign its quarterly submissions to data only two weeks after each quarter's end, she said. And it stands ready to drill down into that data, if necessary, to answer any subsequent inquiries from NHTSA. But to date, the company has received no inquiries.
When NHTSA first began publishing its notices of rulemaking, one of the benefits it highlighted was that some of these systems would pay for themselves through recall and warranty cost avoidance. The premise was that if the OEMs got themselves organized, and began putting their data into a format ready for further analysis, that the OEMs would then do that analysis themselves. When patterns or anomalies were detected, the OEMs would take internal steps to correct the problem before even more vehicles shipped with the same problems. Instead of years, it might take months, weeks, or even days.
Unfortunately, though, recall rates are actually increasing, and are on track to make 2004 a record year in terms of the number of vehicles recalled by the manufacturer. This is significant, because in model years such as 2000 and 2001, more vehicles were recalled than were actually produced. Not all of them can be blamed on TREAD and the increased transparency of data. But some can. In fact, some were reportedly triggered by the manufacturers in anticipation of NHTSA eventually finding the same patterns and anomalies in the data.
Increased recalls were not part of the promise. The idea was to make recalls less necessary, and injuries, deaths, accidents and warranty claims less frequent. So there's really two sides to the data analysis. You're necessarily analyzing after-sale data concerning cars that are on the road. Part One is detecting which cars shouldn't be on the road, and recalling them for repairs. Part Two is using that data to affect current production on a pre-sale basis.
Magnuson displayed examples of the data reports now available to Kia executives, but she was careful to note that the spreadsheets did not contain actual data. In this example, the columns across the top contain numerical data and the chart at the bottom contains a graphical representation. The columns are a bit hard to read, but they're labeled steering, suspension, brakes, parking brake, and engine, and the rows represent the six quarters between Jan. 1, 2001 and June 30, 2002. In the bar chart beneath the numerical data, each of the quarters in question are color coded.
Kia's TREAD Act Reporting System
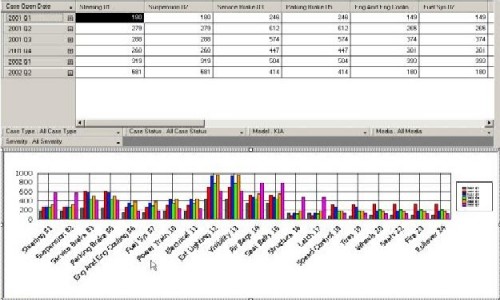
Source: Kia Motors America
Magnuson said she's not so sure how the data is being interpreted and used by the engineering, design, and production people at Kia who are in a position to impact the reliability of vehicles coming off the assembly line. Fortunately, there haven't been many patterns or anomalies to fix. But it's still early in the life of TREAD, so perhaps over time there will be more opportunities to put the data to work internally. Then again, nobody prays for problems.
The Vendor Viewpoint
Subhash Solanki of InfoGain picked up on this theme, suggesting that TREAD Act early warning reports should be seen as merely the output of a process, and not the end of the process. He advised manufacturers to leverage the insights they gain from the data to reduce warranty expense, to increase reliability, and to improve customer loyalty.
As an example, he cited data from an unidentified manufacturer, who used the same brake assembly on two different light truck models. One was a 4x4 and the other was a 4x2 configuration. The 4x4 suffered an unusually high warranty claims rate, while the 4x2 showed a much lower claims rate. The claims data on its own didn't make that distinction. After all, it was the same part number, the same calipers, and the same brake pads. And they were all from the same supplier. But he showed how with the InfoGain software, a manufacturer could identify such a trend, speculate about the cause, and trace it back to differences in weight and aerodynamics between the two vehicle types. Theoretically, a design change would ensue, and lower future warranty claims would result.
He also showed how the InfoGain system could take existing data and use it to project future warranty claims rates. The system takes current sales data, projects future sales volumes, and applies a lag time to the graph of expected warranty claims. In the example he showed covering the model years 2000 to 2006, seasonal factors caused sales to peak in early spring, and warranty claims to peak in late summer.
Another example he showed took historical battery warranty claims data, and projected it 18 months into the future. Expected parts and labor costs were applied, and then a table of total expected costs was constructed based on a range of percentages for failures expected to result in a claim.
Future Events?
Readers who know of future warranty-oriented seminars, panel discussions and seminars are invited to contact the editor with the details. We'll write about them before the fact and perhaps again after they're over. Though it's now summer vacation season, we know of a few events already being planned for the fall.