Home Warranty Claims & Accruals:
Homebuilding, heating and cooling each have their peak seasons. But do warranty claims for new homes and HVAC units also have a peak season? Recent data suggests that claims actually peak later in the year, months after sales do.
More than a year ago, Warranty Week asked the question whether warranty was indeed seasonal in certain industries. With 18 months of data in hand, it's now becoming possible to answer with a tentative yes. Intuitively, one would expect air conditioners and refrigeration units to break down most frequently when it's hot. People say automobile repairs spike during both the hottest and coldest months. But would such phenomenon show up in a chart of warranty claims and accrual rates?
In the June 16, 2003 issue, we looked at warranty in the new home construction industry, and on June 30 we looked at warranty in the heating, ventilation, and air conditioning industry. Back then, only three months of data were available, so those articles turned out to be more like snapshots of those industries. By now, most manufacturers have filed at least six quarters of warranty data with the U.S. Securities and Exchange Commission, allowing us to provide a moving picture of each industry.
Warranty claims and accruals for new homes seem to peak in both the spring and fall. Warranty claims and accruals in the HVAC/R industry seem to peak in the fall only. If you look at the charts below, you'll see the beginnings of a pattern developing, which another year's data will either confirm or contradict.
In the new home industry, the builder usually provides the buyer with a warranty for the basic structure and major systems such as heating, cooling, plumbing, roof, windows, and electric wiring. Additional warranties are provided directly by the manufacturers of major appliances such as refrigerators, stoves, washing machines, and dryers. If the home is sold fully furnished, there may also be warranties issued for the carpets, kitchen cabinets, furniture, and other items.
Supplier Recovery
Typically, the builder acts merely as a clearinghouse for warranty claims, dispatching the responsible sub-contractor to the job when needed. What would be called supplier recovery in the auto or computer industry is almost a given in the new home industry. Whichever sub-contractor/supplier manufactured the product or installed the unit is likely to be asked to assume the cost of its repair during the warranty period. The homebuilder is likely to be left with primarily just the overhead expenses and the cost of occasional claims for which the responsible sub-contractor cannot be tracked down.
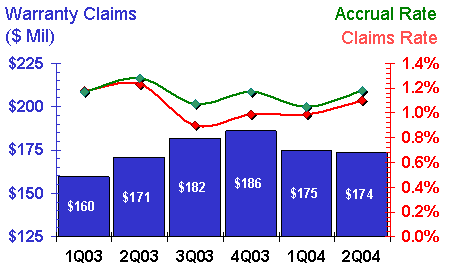
As the chart below illustrates, warranty claims rates in the new home industry have remained within a tight range of 0.9% to 1.2% for the past 18 months. Warranty accrual rates have been in a similarly tight range of 1.0% to 1.3%. If anything, that's a confirmation that the supplier recovery process is working very well, in contrast to industries such as computers and automobiles where the customer-facing manufacturer absorbs rates in the 2% to 4% range.
New Home Construction
Warranty Claims & Accrual Rates,
First Quarter 2003 to Second Quarter 2004

Source: Warranty Week from SEC data
The chart above shows a noticeable peak during the second quarter of 2003 for both claims and accrual rates, though in absolute terms the amount of claims during that quarter were on the low side at $171 million. During the fourth quarter of 2003, claims in dollar terms peaked at $186 million, while both claims and accrual rates in percentage terms showed a secondary peak. We'd suggest this is the true peak, with the peak in claims lagging a few months behind the peak in home sales. The second quarter peak might be more a function of lower sales than higher claims.
It looks like this pattern is repeating itself in 2004. Claims and accrual rates have once again turned upwards during the second quarter, while claims in dollar terms have remained close to their historical average of $174.5 million per quarter. The reason of course is that the claims and accrual percentage rates are computed by dividing claims or accruals in dollar terms by homebuilding revenue in dollar terms. Sales peaked in the third quarter of 2003 at $20.25 billion, and have trailed off in the three quarters since. Claims peaked in the fourth quarter -- a three-month lag time -- but $186 million in claims and $18.87 billion in sales once again drove the claims rate below 1%.
Individual homebuilders have a different story to tell. Some have seen sales and claims rise proportionally, while others have sales rise faster or slower than claims. In fact, one company -- Arvida/JMB Partners LP -- actually saw homebuilding revenue fall to zero this year. They're now earning their living exclusively from real estate services. But they still have claims to pay on homes they built in years past, so mathematically their claims rate is infinitely high.
Industry Top Ten
Fortunately, we didn't have to go searching for the infinity symbol on the keyboard to construct the chart below, because it contains only the top ten publicly-held homebuilding companies. They're ranked not by revenue or warranty claims, but instead by the change in their claims rates since a year ago. Therefore, Champion Enterprises, a major manufacturer of pre-fabricated homes, is at the top thanks to the 0.63% decline it saw in claims rate between the second quarter of 2003 and the second quarter of 2004.
Fleetwood Enterprises, which makes both pre-fab homes and recreational vehicles, saw its claims rate decline by 0.61% during the past year. In general, the companies with the highest rates are those making either motorized RVs or pre-fab homes, whether they're assembled at a fixed site or towed on a trailer hitch. Those with the lowest claims rates are those building traditional fixed site homes that have neither motors nor wheels.
Three others saw their claims rates fall by smaller amounts, and five homebuilders saw their claims rate as a percentage of revenue increase. Most worrisome of all was Lennar Corp., whose 0.5% rise and 1.6% rate are relatively high for the site-built home industry. Others such as KB Home, Pulte Homes, and D.R. Horton have remained at or below 1%. In fact, Lennar is actually a bit down in the second quarter from the 1.8% claims rate it saw in the first quarter of 2004.
America's Top New Home Warranty Providers
Claims and Accruals as a Percent of Sales
2Q 2004 vs. 2Q 2003
| Claims as | Change | Accruals as | Change | |
| % Product | from | % Product | from | |
| Company | Sales | 2Q '03 | Sales | 2Q '03 |
| Champion Enterprises | 5.8% | -0.6% | 5.1% | -0.8% |
| Fleetwood Enterprises | 3.0% | -0.6% | 2.6% | -0.7% |
| KB Home | 0.6% | -0.1% | 0.8% | -0.3% |
| Pulte Homes Inc. | 1.0% | -0.04% | 1.0% | +0.04% |
| D.R. Horton Inc. | 0.3% | -0.01% | 0.5% | +0.02% |
| Ryland Group Inc. | 0.6% | +0.01% | 0.5% | -0.1% |
| Centex Corp. | 0.4% | +0.1% | 0.5% | +0.3% |
| NVR Inc. | 0.9% | +0.1% | 0.9% | +0.2% |
| Beazer Homes USA Inc. | 1.1% | +0.2% | 2.0% | +0.9% |
| Lennar Corp. | 1.6% | +0.5% | 1.6% | +0.3% |
Source: SEC Form 10-Q & Form 10-K
Missing from this chart are numerous builders of RVs such as Thor Industries Inc., Monaco Coach Corp., National R.V. Holdings Inc., and Winnebago Industries Inc. Unlike Fleetwood, Coachmen, or Skyline, they do not build any pre-fab or modular homes, and thus they will be analyzed as automotive manufacturers in the weeks ahead alongside the makers of trucks, buses, fire engines, and other large vehicles.
By the way, there's a whole other industry not depicted here, where real estate companies, insurance companies, and third parties sell extended warranties for existing homes, and sometimes even for new homes (above and beyond the basic product warranty). It's a whole other industry with a completely different set of companies. And while we can say definitively that the U.S. homebuilding industry spent close to $700 million honoring warranty claims last year, we're not yet in a position to gauge the size of the extended warranty industry for homes. Such an undertaking is in the works for the months ahead, however.
Heating and Cooling Manufacturers
The very name HVAC/R connotes a mixture of product types, sweeping up everything from ice-making machines to hot water heaters. In this category we're including some vendors whose interest in HVAC/R is strictly automotive (Eaton, Ingersoll-Rand, and Visteon), and some whose interest is strictly home appliance (Whirlpool, Maytag, and Fedders). We're also including several vendors whose majority interest is in another industry (United Technologies in aerospace, American Standard in plumbing, and SPX in TV broadcast towers).
But whether it's a cooling tower for a factory or an air conditioner in the window, it's all part of the HVAC/R industry in its broadest definition. The problem is that by mixing together everything from United Technologies' helicopters and elevators to Manitowoc's mining equipment and Maytag's washing machines, any noticeable trend in HVAC-only warranty claims is going to be partially obscured. If only the diversified manufacturers would break out their warranty expenses by product line or division!
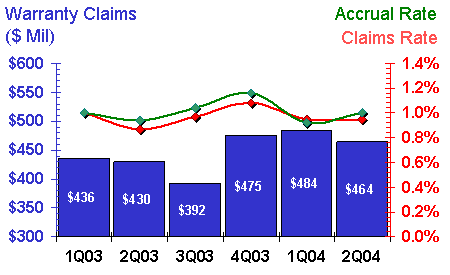
Still, in the chart below, the aggregation of some 43 different vendors shows a pattern where the claims and accrual rates peak towards the end of the year and fall during the first half of the year. Whether this is the pattern of HVAC units or helicopters is impossible to know, but we can be certain it's the pattern of the 43 manufacturers in this group.
Heating, Ventilation, Air Conditioning & Refrigeration
Warranty Claims & Accrual Rates,
First Quarter 2003 to Second Quarter 2004

Source: Warranty Week from SEC data
As the chart above shows, claims rates have remained within a range of 0.9% to 1.1% for the past 18 months, while accrual rates have fluctuated from 0.9% to 1.2% during the same period. Both United Technologies (Carrier) and American Standard (Trane) have remained above this range for the entire period, which we believe is a sign that their other product lines naturally experience a higher claims rate. Then again, York International, which is something of a "pure play" in HVAC manufacturing, also has seen its claims and accrual rates fluctuate within a range of 1.6% to 2.2% over the past 18 months. Lennox International, another "pure play" HVAC vendor, hasn't filed financial statements for the past nine months. But during the preceding nine months, its claims and accrual rates were always within a range of 1.0% to 1.3%.
Cyclical Pattern?
We suspect that HVAC claims and accrual rates will continue rising through the third and fourth quarters of 2004, and will then begin falling back in early 2005. This would suggest a peak three or four months after the heat of summer and a trough three or four months after the cold of winter. So what we're measuring now could be the lowest these manufacturers' claims and accrual rates will be all year.
In the table below, the top ten HVAC/R warranty providers are ranked in terms of their claims rates, from most to least improved. In the past year United Technologies has cut its claims rate by 0.5% and its accrual rate by 0.6%. Ingersoll-Rand has seen its claims rate rise by 0.5% and its accrual rate rise by 0.3%. Overall, four of the top ten have cut their claims rates while five have cut their accrual rates. Three have cut both.
America's Top HVAC Providers
Claims and Accruals as a Percent of Sales
2Q 2004 vs. 2Q 2003
| Claims as | Change | Accruals as | Change | |
| % Product | from | % Product | from | |
| Company | Sales | 2Q '03 | Sales | 2Q '03 |
| United Technologies | 1.7% | -0.5% | 1.8% | -0.6% |
| York International Corp. | 1.6% | -0.1% | 1.7% | -0.3% |
| Johnson Controls Inc. | 0.2% | -0.01% | 0.2% | -0.02% |
| Masco Corp. | 0.3% | -0.01% | 0.5% | +0.2% |
| Maytag Corp. | 3.0% | +0.1% | 3.0% | +0.6% |
| American Standard Cos. | 1.3% | +0.1% | 1.6% | +0.2% |
| A.O. Smith Corp. | 2.0% | +0.1% | 1.7% | -0.03% |
| Honeywell International | 1.1% | +0.2% | 1.2% | +0.1% |
| Whirlpool Corp. | 2.7% | +0.3% | 2.6% | -0.1% |
| Ingersoll-Rand Co. Ltd. | 1.4% | +0.5% | 1.3% | +0.3% |
Source: SEC Form 10-Q & Form 10-K
There's really nothing alarming about any of this data. Maytag's and Whirlpool's seemingly high rates are no doubt due to their heavy involvement with major appliances, where 2.7% to 3% rates are normal. Ingersoll-Rand's 0.5% rise might be alarming were it not off a base of only 0.9% a year ago. Then again, the past six months have been close to 1.4% while the preceding nine months were below 1%.
We half considered adding to this mix an analysis of closely-related warranty sectors such as home and office furnishings, building materials, and construction equipment. But 15 of the 43 HVAC manufacturers would have appeared multiple times, and the overlap also would have been heavy with automotive sectors. And those who are making neither HVAC gear nor vehicles are selling everything from backyard pools to filing cabinets.
Would this be of any value? Or would readers prefer to see some "micro" analyses of a category as narrow as, say, just carpeting or just furniture? Next week we'll take a day off for the Labor Day holiday and come back with an automotive warranty roundup on Wednesday, Sept. 8. The topic after that is a reader's choice. What haven't you seen done, or what industry would you like to see updated again? Send your thoughts to the editor at earnum@warrantyweek.com.


