Warranty Conference,
Part Eight:
Behind the numbers used in warranty metrics, there's a lot that's left up to the discretion of each company. This makes comparisons somewhat unreliable without a standard set of definitions detailing what is and what isn't a warranty expense.

Warranty statistics used to be rare and untrustworthy. Now they're public information included in most manufacturer's financial statements, but they're still untrustworthy. For as pointed out by Tom Washburn, warranty metrics and planning manager at Hewlett-Packard Co., what is and isn't reflected in those public numbers is subject to the choices made by each company's accountants and auditors.
At the Warranty Chain Management conference held last month in San Francisco, Washburn teamed up with Eric Arnum, editor of this newsletter, to provide an overview of what all these numbers mean. Back in 2002 and before, meaningful statistics were hard to come by. For instance, somebody in the Buick division of General Motors Corp. once stated that their warranty expense was in the ballpark of 2% of revenue. This became a sort of rule of thumb for the whole auto industry, whether you were talking about diesel engines or sunroofs.
The question for manufacturers is what does that 2% figure mean? Was Buick at the high end or the low end of the spectrum at that level? What about its suppliers? Does that 2% figure include supplier recovery efforts, or is it what Buick pays in claims?
Washburn asked the audience whether it was possible to do industry comparisons. "Can I compare myself against Dell or IBM? Can Ford compare themselves against General Motors?" The answer, it seemed, was no, at least not yet, if all that's available are the raw numbers currently included in Form 10-Q and 10-K financial statements. The warranty claims ratio is not yet as certain as a price/earnings multiple, because the components of the calculations and their definitions are not at all as certain as terms such as price and earnings.
The Financial Accounting Standards Board
FASB Interpretation Number 45 has certainly provided a more accurate glimpse of warranty costs across all manufacturing industries. Washburn said that in 2001 a consulting organization tried to ascertain warranty costs across the information technology business. However, he said the results did not seem to be very accurate, based upon a comparison between the external numbers in the final report and HP's and Compaq's own confidential internal numbers. "In some cases, we had a double-digit variation," he said.
FIN 45 provides a much broader and complete picture than was ever available before. However, the resulting paragraph 14(b) warranty tables are only aggregates of all the payments made and payments received; inputs and outputs; deposits and withdrawals. They do not detail payments made to customers or reimbursements made by suppliers. Instead, they add these together, resulting in a single number for net claims paid.
But more than anything, the warranty tables don't tell you what is and isn't included in terms of costs. Does the cost of a claim include a portion of the cost of the call center? Does it include a percentage of the IT budget? Does it include shipping costs for returned parts? Is the cost of parts computed based on their original manufacturing cost, their replacement cost, or perhaps even their retail price? Or more fundamentally, is the cost of parts included at all?

Washburn said it is really difficult to resist the temptation to take the warranty claims rates of two companies, measure the gap between them, and to then try to infer some conclusions about how well each company is managing product quality and warranty costs. "You can draw a conclusion. However, it's built on a false premise," he said, "because we really don't understand what's behind the costs and the financial accounting that's associated with it."
He said that without the ability to understand, in detail, the components that make up these measures (claims, accruals, and product sales), it remains doubtful that the current level of warranty cost accounting standards will ever allow competitive comparisons. For example, Company A may report accrual information for only base warranties offered on their products, while Company B may obscure their accrual numbers by combining both product warranty and extended warranty deferred revenue in the same accounting line.
Changing Over Time?
What may be possible however is to compare a company against itself. A key assumption with this approach would be that the accounting practices regarding warranty remain constant overtime. However, Washburn said that even in this regard, anecdotal evidence suggests that this is not always the case with some U.S.-based manufacturers.
He said that even within HP there are several accrual models used at different times by different business units. Before their 2002 merger, HP and Compaq each counted things differently. Though those differences have narrowed in the past three years, they haven't been entirely eliminated. "So you're not going to get apples to apples all the time when you're looking at accrual information," Washburn said.
The key would be to understand when and how accounting standards were modified, which again, FIN 45 does not explicitly require companies to detail. Arnum noted that all the publication specifies is that companies reveal their "accounting policy and methodology used in determining its liability for product warranties." That's the exact language used in paragraph 14(a) of FIN 45. Most companies meet this rather vague requirement by including only the most generic boilerplate language ("We accrue for warranties at the time of sale, etc.").
"Right now, the way the standards are set, they're very loose," Washburn said. "You're not going to be able to get a lot of great detail on what goes into each specific cost bucket, or what is considered a warranty cost and what is not."
Washburn then displayed what he called a generic warranty cost formula:

- Accrual: This is money set aside to pay for future expected failures or claims within the warranty period.
- Supplier Warranty: Money paid for product suppliers to cover all or part of warranty expenses.
- Variance: The dollar difference between gross operational spend (period warranty expenses related to service claims) and amortized warranty funds for the period released from the reserves.
- Business Unit Operational Costs: Actual costs of managing warranty in a business unit. This could include headcount, IT systems costs, etc.
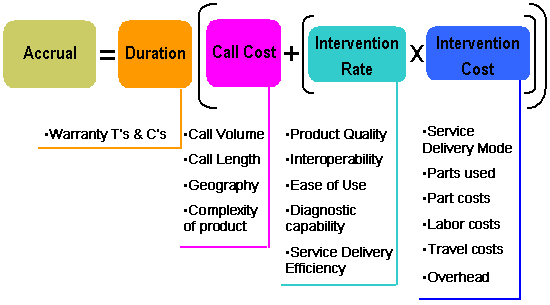
This is a generic example, he noted, and is not HP's own formula. The business practices of specific companies such as HP could require additional components to be added to this formula. Washburn then took just the warranty accrual component and broke it down even further:

- Duration: The length of time the product is covered under warranty.
- Call Cost: The anticipated costs of phone support, diagnosis, etc.
- Intervention rate: The rate at which a product is expected to experience a problem resulting in a warranty claim.
- Intervention Cost: The actual cost of a warranty claim -- can include parts, labor, travel, overhead and miscellaneous costs.
"When you start breaking all these down -- and I'm sure the list can go on -- you can see that some people may or may not include some of these things, depending upon their business model," Washburn said. Accounting literature provides general guidance in this space, but application of that guidance can differ within and across companies. One must proceed with caution when doing cross industry or competitive comparisons based on this data. Accrual methodologies can and do change over time.
All the components of a warranty claim are likely to be counted as costs, but are they always going to be counted as warranty costs? Washburn said some companies could take certain components such as warehouse or travel costs and count them as a generic cost of sales, or as an operating expense, rather than as a warranty expense. This would result in correct figures for margins and profitability, but it would underestimate the total cost of warranty.
Even with a calculation as simple as a company's warranty claims rate, Washburn noted that the percentage is subject to not only all these variations in the numerator, but also variations in the denominator. One company may segment its total revenue by product, hardware, software, service, supplies, finance, investment, and other. Another company may simply segment it into U.S. and rest of world. And some may provide no segmentation data at all. In these instances, the amount counted in the denominator as "warranted product revenue" may be based upon estimates.
Washburn said he wants to hear from other manufacturers about possibly beginning an effort to standardize the inputs of these equations, so that all companies are including and excluding the same components. He also wants to gauge interest in the possibility of manufacturers joining together to lobby the Securities and Exchange Commission, the Financial Accounting Standards Board, and others about putting more detail into existing rules. Possibly, the group may even call for enforcement of existing rules.
Three Different Approaches
Despite the known and unknown variances in warranty accounting, Arnum said he still believes the figures can be shaped into something comparable. He took the example of Detroit's Big Three automakers and their reported warranty expenses as an illustration of the merits of three different approaches to analyses.
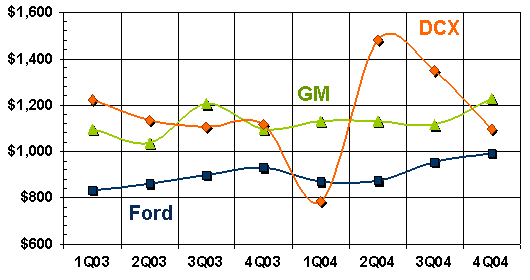
First, since the raw FASB FIN 45 tables that are now part of Form 10-Q and 10-K financial reports are provided in dollar terms, Arnum showed the warranty record for the Big Three for the past two years in terms of the quarterly amounts they reported spending on warranty claims:
The Big Three
Warranty Claims in Dollar Terms
2003 - 2004

As this chart shows, DaimlerChrysler reported both the highest and lowest quarterly amounts of the Big Three. In fact, these reports occurred sequentially during the first and second quarters of 2004. There's a noticeable dip in the orange line during the first quarter, and a noticeable peak in the line during the second quarter. This would suggest that perhaps some of the first quarter's warranty claims were not tallied until the second quarter. So perhaps the actual amount DCX spent to satisfy warranty claims during the first quarter was more than $789 million, and the actual amount spent during the second quarter was less than $1.479 billion.
The shape of the lines for the other two automakers is rather flat, adding further weight to the suggestion that the peaks and valleys in the middle of the DaimlerChrysler line are not reflective of actual fluctuations in warranty claims. Then again, GM had a bump in the third quarter of 2003, and looked like it was headed upwards again at the end of 2004. So perhaps sometimes these fluctuations actually do reflect meaningful changes in warranty claims rates.
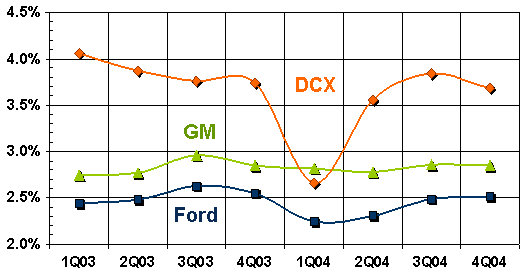
However, keep in mind that these are just raw dollar figures. If sales are increasing, one would expect claims to also increase -- hopefully in a linear fashion. If sales equals $100 and claims equals $2 now, one would hope that when sales get to $150, claims would be $3. In both cases, the claims rate would be 2%, which for these particular automakers would be unusually low:
The Big Three
Warranty Claims as a Percentage of Sales
2003 - 2004

As this chart shows, GM and Ford seem to meander around the 2.5% to 3.0% level, while DaimlerChrysler tends to fall into the 3.5% to 4.0% range. This is no surprise, Arnum said, because Chrysler, Jeep, and Dodge are issuing seven-year powertrain warranties, while most of GM and Ford's divisions tend to provide three- or four-year warranties. All other things being equal, the lengthier warranties will tend to cost more.
Each of the automakers provides a good level of detail regarding just auto revenue versus other types such as finance and services. But they say little about what is and isn't included in the numerators -- the components of warranty costs as outlined by Washburn. For instance, they do not explicitly say whether product recall costs are counted as warranty expenses, or if they're counted as expenses totaled up elsewhere on the income statement.
Accounting for Recalls?
This graph would seem to suggest that recalls are counted separately. For while the number of vehicles covered by recalls during 2004 hit an all-time record, these three lines barely changed from early 2003 onward. The only major dip in the graphs was DaimlerChrysler's first quarter 2004 figure, and as suggested above, that seemed to have more to do with the lag time between the work and the payment. The line for Ford looks like a low amplitude sine wave, which may suggest some seasonality to warranty claims, or at least some seasonality to the ratio between sales and claims.
What we're doing, of course, is comparing each company to itself. If, for instance, one could theorize that for Ford 2.5% is "normal," then any fluctuations above or below that level would take on more significance. The problem is, there's a different "normal" for GM and DCX.
So let's take one more step, and use the beginning figure for each company as their "normal" rate. For the narrow purposes of this illustration, let's assume that wherever they began 2003 is their normal warranty claims rate. So for Ford, "normal" is 2.44%, the level computed based on the first quarter of 2003's reports of $834 million in claims and $34.159 billion in auto sales. Let's set that equal to 1.0, and let's do the same for GM and DCX, setting their starting rates to equal 1.0.
The Big Three
Warranty Claims in 2003 - 2004
Jan. 1, 2003 = 1.0

The graph now shows how these three companies have fared over time, comparing them not only to themselves but also to each other. Now, it doesn't matter that Chrysler's warranties last longer. They were seven years in 2003, and they were seven years in 2004. So nothing changed, at least not in a way that in and of itself would have changed the company's warranty expenses. And again, the first quarter 2004 dip looks more and more like an accounting anomaly.
The scale is set rather wide to allow for this massive dip. Were these lines to be drawn on a tighter scale, it would become more obvious that over time DaimlerChrysler actually is reducing warranty costs as a percentage of auto revenue. The beginning of 2003 was actually the highest point on the graph. And except for that dip in the middle, the end of 2004 was the lowest.
There are only three companies on this graph. Now imagine if there were dozens, or perhaps hundreds of companies, compared to themselves in a normalized fashion that also allows them to be compared to each other. Imagine if every manufacturer of either auto parts or vehicles was represented -- some 135 different companies. We won't do that this week, but we will in the near future. That data wasn't available in time for the WCM meeting in early March, but it will be available for the AIAG's early warning standards conference in Detroit on May 13.
What that data will show is that auto manufacturers such as Cummins, Navistar, Thor Industries, John Deere, and Caterpillar are now radically reducing their relative levels of warranty spending, while companies such as Visteon and Johnson Controls are lately on an upward trend. That the latter two are both suppliers to some of the OEMs who are now on a downward slope should be taken as a signal that perhaps at long last the industry's supplier recovery efforts are having a meaningful impact.
| Go to Part One: Opening Keynote Speeches |
| Go to Part Two: AIAG Early Warning Standard |
| Go to Part Three: Extended Warranties 101 |
| Go to Part Four: Customer Loyalty |
| Go to Part Five: National Regulatory Trends |
| Go to Part Six: Auto Warranty Fraud |
| Go to Part Seven: PC & Appliance Warranty Fraud |
| This is Part Eight: Warranty Metrics |
Part Seven: Warranty fraud is a big problem for both manufacturers and warranty administrators. What's surprising is how deliberate and organized their schemes have become.April 19, 2005 Top 50 Warranty Providers: Manufacturers spent more than $25 billion last year on warranty claims, but sales rose a bit faster, so claims as a percentage of revenue fell slightly. Most of the top 50, however, saw their claims rates fall more.May 3, 2005


