Warranty Claims & Accruals:
Ten quarters of data for the top ten U.S.-based warranty providers show just how variable and seasonal claims rates can be for some companies and how consistent they've been for others.
As half-year financial results continue to pour in for manufacturers, it occurred to us that the warranty industry has now passed something of a milestone. Given that most manufacturers began reporting details about their warranty claims and accruals at the beginning of 2003, therefore most are now filing their tenth consecutive quarterly report containing warranty data.
We're going to do something that is likely to annoy at least three groups of people. First, all those subscribers who receive their email stripped of all graphics as a safety precaution are going to howl when they see that the newsletter below contains no data. Fortunately, there's an easy fix for that: go to the online version of this article at http://www.warrantyweek.com/newsarchive/ww20050823.html and all the graphics will be included. The same goes for subscribers to the Plain Text Edition of Warranty Week. Although the percentages will be included in a tabular format, in this case a picture really is worth a thousand words.
Second, all those financial types who wish the Financial Accounting Standards Board had never required manufacturers to detail their warranty accounting, and who hoped that nobody would ever process the data into an easily understandable form are going to be severely disappointed by the charts below. Back in 2002 and before, this data was considered top secret. Now, here it is for all to see on a free and public Web page.
Third, statisticians will recall Mark Twain's famous quote -- which we dare not repeat for fear of triggering all those content filters -- as they see the format of the data below. In each case, we adjusted the vertical scale in a way that somewhat exaggerates the curvature of the lines, making for instance something as steady-state as Ford Motor Co. look somewhat chaotic. We leave it up to the reader to decide if plus or minus 0.2% is a wide or a narrow band for warranty claims to remain within.
What follows are ten charts for the ten largest U.S.-based warranty providers, based upon the amounts reported as warranty claims paid during the first half of 2005. Each chart contains ten data points for warranty claims as a percentage of product sales (the red line), and ten data points for warranty accruals as a percentage of product sales (the green line).
We should note that because the rankings are based on the amount reported during the first half, two companies that didn't report had to be left off. General Electric Co., which we suspect would have ranked fourth, has decided not to report quarterly, as required by FASB. Instead, they have chosen to report details of their warranty outlays only at the end of each year. Second, Sun Microsystems would likely have been somewhere in the bottom half of the top ten, but they won't file their annual report until mid-September, so we didn't have enough solid data. In their absence, we have included Deere & Co. and Whirlpool Corp., which would have otherwise been eleventh and twelfth.
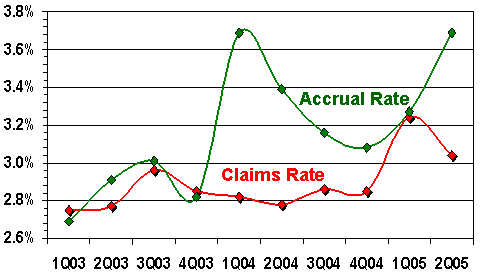
It's no surprise that General Motors is America's largest warranty provider. That's a slogan unlikely to be found in any of their advertising material, but it's certainly true. So far in 2005 GM has paid out nearly $2.4 billion, but amazingly, that's still only 3% of the company's auto sales revenue. In the chart below, it's clear from the shape of the curves that GM began adding some extra accruals last year, and has begun paying some extra claims this year. For the most part, claims have actually remained in a rather tight range of 2.8% to 3.2%, which the vertical scale somewhat exaggerates. But the early 2004 spike in accruals is hard to miss.
Figure 1
General Motors
Warranty Claims & Accrual Rates
First Quarter 2003 - Second Quarter 2005
Source: Warranty Week from SEC data
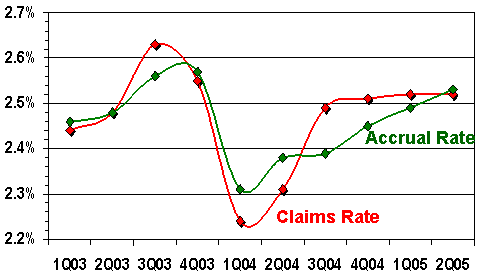
Ford could complain about the same kind of statistical exaggeration. Using a different scale, these lines would look much flatter than they do below. However, what's important to note is how the red and the green lines follow each other so very closely. This is a clear sign that the company is quite aware of the quarterly fluctuations in product warranty claims, and is matching them ever so closely with changes in accrual rates. The lines are never more than 0.1% apart, which for a company paying nearly a billion dollars a quarter in warranty claims is about as close to perfect as can be hoped for.
Figure 2
Ford Motor Co.
Warranty Claims & Accrual Rates
First Quarter 2003 - Second Quarter 2005
Source: Warranty Week from SEC data
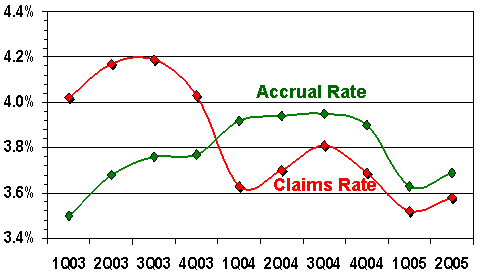
Next we turn to the computer industry, where HP, Dell, and IBM dominate not only sales, but also warranty claims payments. As seen below, HP has turned in a claims experience that looks something like an amusement park's roller coaster. It's perhaps not as scary a ride as some others to follow, but it does show a good-sized decline in the claims rate from a high of 4.2% to a recent low of 3.6%. That is nowhere near the ambitious 50% reduction once called for by the old boss, but then again, perhaps that is one of the primary reasons there's now a new boss. More puzzling is the rise then fall of the accrual rate, which would have inversely impacted earnings. When the accrual rate is boosted, profits decline. When the rate is cut, profits rise.
Figure 3
Hewlett-Packard
Warranty Claims & Accrual Rates
First Quarter 2003 - Second Quarter 2005
Source: Warranty Week from SEC data
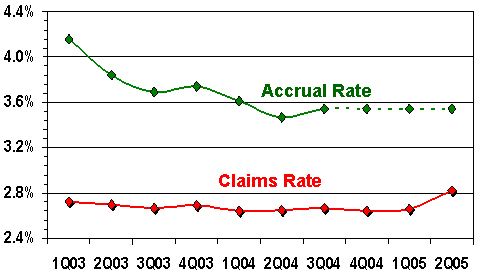
The data for Dell includes a significant amount of uncertainty for two reasons. First, the company provides no meaningful product line segmenting data, so it's difficult to ascertain what percentage of total revenue is in fact warranted product revenue (as opposed to finance revenue or service revenue). We're estimating that 90% of total revenue is warranted product revenue based upon the example set by Apple Computer, but the ratio for Dell could in fact be as low as 77%. In that case, Dell's warranty claims rate could be closer to 3% company-wide.
Second, Dell now mixes its extended warranty deferred revenue and product warranty accruals together. This has the effect of obscuring the true size of the company's extended warranty operations, and more relevant to this discussion, making it impossible to compute the percentage of revenue put aside to pay future warranty claims. What we've done in the chart below is to assume that the accrual rate has continued at the 3.5% rate seen four quarters ago, using a dotted line to denote our assumptions. If anyone has better data, please let us know. Dell has already declined.
Figure 4
Dell
Warranty Claims & Accrual Rates
First Quarter 2003 - Second Quarter 2005
Source: Warranty Week from SEC data
What's significant to note is the gap between the red and the green lines. Scroll back and look at how Ford makes one line look like the shadow of the other. Now look again at Dell. The lines have rarely been closer than a full 1% gap. This has the effect of causing Dell's warranty reserve to bulge, because both accruals and extended warranty sales are pouring cash in and claims are only trickling out. At some future point -- probably when earnings are coincidentally a little thin -- the company will have to make an adjustment that will pour some of this excess savings into the bottom line.
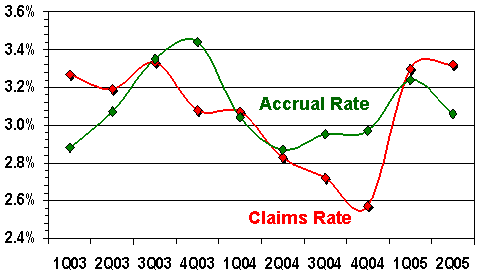
IBM, we note, was six quarters into a steady decline in warranty claims rates when they suddenly snapped back to the 3.3% range last seen in 2003. What's puzzling here is the news that Lenovo released on the occasion of its acquisition of the PC Division, namely that IBM's PC warranty claims rates were high and rising at the time of the sale. We can't quite square that with the data here, which is based upon all IBM hardware sales -- not just PCs. But it illustrates how a very large and diverse company can mask a manufacturing problem with just one product line as long as none of the others have their own spike in claims.
Figure 5
IBM
Warranty Claims & Accrual Rates
First Quarter 2003 - Second Quarter 2005
Source: Warranty Week from SEC data
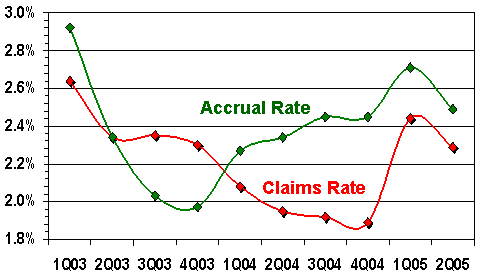
Two truck and heavy equipment manufacturers made the top ten list (four if GM and Ford are included), while Cummins and Navistar just missed. Caterpillar, like IBM, shows a steady decline followed by a recent spike in claims. We suspect that down below the chart for Deere is proof that warranty claims are highly seasonal and cyclical for some manufacturers. But that doesn't explain Cat's eight quarter decline followed by two quarters of increases. And it doesn't explain why accruals were rising even as claims were falling. If it's any consolation, the company is still below its 2.6% peak claims rate.
Figure 6
Caterpillar
Warranty Claims & Accrual Rates
First Quarter 2003 - Second Quarter 2005
Source: Warranty Week from SEC data
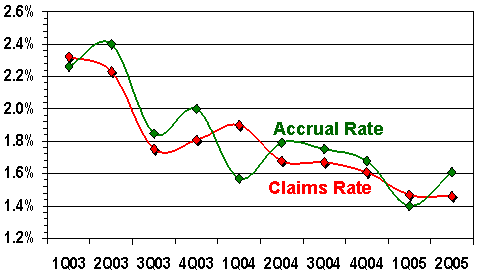
United Technologies, given its diverse product line, is as much a benchmark for aviation as it is for air conditioning. Whichever it is, the news has been consistently good. As with Ford, the accrual rate has closely shadowed the claims rate. But unlike Ford, the trend has consistently been downhill all the way. Beginning 2003 with a 2.3% claims rate, the company is under 1.5% as of the middle of 2005.
Figure 7
United Technologies
Warranty Claims & Accrual Rates
First Quarter 2003 - Second Quarter 2005
Source: Warranty Week from SEC data
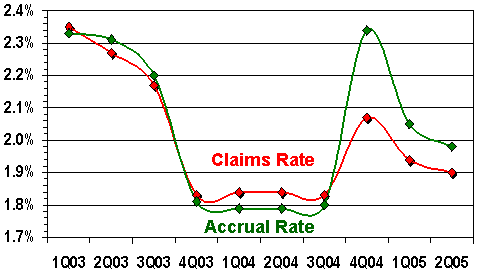
Cisco Systems, until very recently, seemed to have successfully lowered its claims rate from the 2.2% to 2.3% range to a 1.8% to 1.9% range. But the last three quarters have been somewhere in the middle of those ranges. And accruals, which are the funds management decides to put aside to fund future claims, went up by more than half a percent in one quarter. Again, the vertical scale somewhat exaggerates the variation, but the chart would look like a river gorge no matter what scale was used.
Figure 8
Cisco Systems
Warranty Claims & Accrual Rates
First Quarter 2003 - Second Quarter 2005
Source: Warranty Week from SEC data
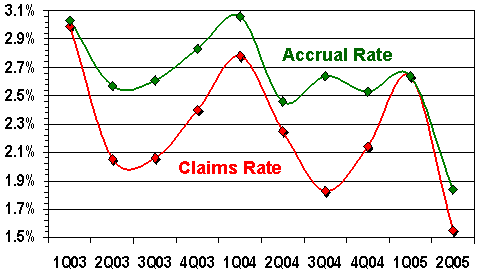
As mentioned, Deere is something of a poster boy for the theory that warranty claims tend to be seasonal in certain industries. It's no surprise given that many of Deere's products are used on lawns, farms, and golf courses. One would expect that sales of products used outdoors during the growing season would follow a cyclical pattern. But what we see here is a peak in claims rates during the cold months. The reason is the sales lag: sales tend to slow late in the year, just in time for that brand new equipment purchased in the spring and summer months to need warranty work. The result is that claims rates rise and fall by as much as a full percentage point.
What's especially encouraging is that the height of the winter peaks has been consistently declining -- from 3% in the winter of 2003 to 2.8% in the winter of 2004 and 2.6% in the winter of 2005. Likewise, the summer troughs keep getting deeper: 2%, 1.8%, and most recently, 1.55%. If we were doing a paper on this trend for a graduate course in warranty analysis, our professor might accuse us of making up the data it's so perfect.
Figure 9
Deere & Co.
Warranty Claims & Accrual Rates
First Quarter 2003 - Second Quarter 2005
Source: Warranty Week from SEC data
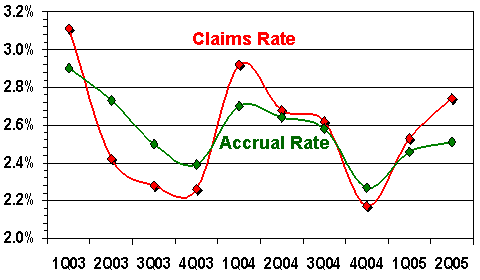
Last but not least is Whirlpool. We see suggestions of seasonality here as well, as well as some of the same downward trend of the consecutive peaks and valleys. But if the trend with Deere's data is hard to miss, with Whirlpool it's harder to see. Perhaps with a few more quarters of data the trend will be more apparent.
Figure 10
Whirlpool
Warranty Claims & Accrual Rates
First Quarter 2003 - Second Quarter 2005
Source: Warranty Week from SEC data
As noted multiple times, the vertical scale somewhat exaggerates the curvature of some of these lines. However, what it also does is provide us with a boundary for each of these companies' product lines. For instance, in ten quarters none of the computer makers went above 4.2% or below 2.5% in their claims rates. One could theorize that this is the "normal" range for computer makers. Anything above or below this range is unusual.
Likewise, for GM and Ford, anything within the range of 2.25% to 3.25% is typical. In fact, one could argue that 2.5% to 3.0% is more of the "normal" range, and the handful of data points outside this band are suspicious. For as the Deere example showed, the warranty claims rate is as dependent on sales as it is on claims. If cars fly off the lot one quarter because everybody's getting a discount from the dealer, the claims rate will fall immediately and rise later on after those cars have been on the road a while. And if sales slow because of the weather or the price of fuel, the cars sold last year will still need fixing.
| Go to Part Two |


