Medical Warranties:
Though health services don't come with warranties, much of the medical and scientific equipment used by doctors, hospitals, and laboratories is in fact warranted. But it takes a crisis before most companies will say more than the required minimum about their costs.
Whether it's a machine used in a laboratory, a device used by a doctor, or even a surgical implant, chances are good that it carries a warranty. At last count, roughly 140 U.S.-based manufacturers of medical and scientific equipment and devices are at least partially reporting their warranty expenditures in financial statements filed with the Securities and Exchange Commission.
Warranty claims are averaging close to 1% of product sales for these 140 manufacturers as a group, but as we will show with a series of charts to follow, there is quite a bit of variance between quarters as well as amongst manufacturers. That could partially be a function of seasonal changes in sales volumes, and partially a function of the magnified effect even a minor defect can have on a small company's income statement when perfection is expected. But we suspect that in the absence of anybody publishing hard numbers, some manufacturers are content to bury the specifics of their warranty fluctuations in the footnotes.
Don't Know Why
We're not going to delve too deeply into the "why," however. We'll leave it to those who have an expertise in the field to make sense of these statistics. We're not doctors, and we're certainly not auditors. Unlike retail items such as computers or automotive, this is not an industry in which we profess any level of familiarity with either the products or the producers. To us, lasers are those things they shine on the ceiling during "Baba O'Reilly," and plasma is what we watch the football game on every weekend. Despite that deficiency, however, we know is that these companies manufacture everything from artificial hearts to X-ray machines, and we know that so far this year they've reported $375 million in warranty claims.
Let's start with an aggregate view of the industry. First of all, in last week's newsletter, we divided up the world of warranty into ten industries, assigning each manufacturer to one and only one industry. Therefore, because neither General Electric nor Eastman Kodak fit neatly into one of the ten identified industries, we lumped them into the "other" category. That was last week.
This week, both GE and Kodak deserve to be at least partially included in the medical category. However, we're not going to include GE, first because the company itself states that most of its warranty expense arises from sales of turbines and other energy-generating products, and second because the inclusion of GE would by itself easily double the size of the medical and scientific warranty category. We estimate that GE has spent close to $400 million honoring warranty claims so far this year, which is somewhat more than the other 140 manufacturers did as a group. Which leads to our third reason: GE won't report any hard numbers until its annual report arrives next March, so we'd be guessing until then, and we'd be mixing those guesses with 140 sets of hard numbers.
Kodak Is Included
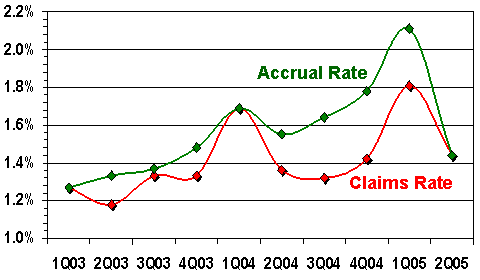
We are, however, going to include Eastman Kodak in the aggregate this time, and we're going to spotlight them as one of the top ten medical and scientific equipment warranty providers. Their medical and dental imaging product lines might not in fact rank in the top ten after subtractions are made for their office equipment and photographic equipment warranties, but we can't make any assumptions about warranty cost per product line or per division if the manufacturers don't release that data. But this week, Kodak is in, and therefore some of the totals and percentages won't match up to the data in last week's newsletter. In a typical quarter, Kodak reports anywhere from $11 to $19 million in warranty claims, which corresponds to anywhere from 1.2% to 1.8% of total equipment revenue (see Figure 3).
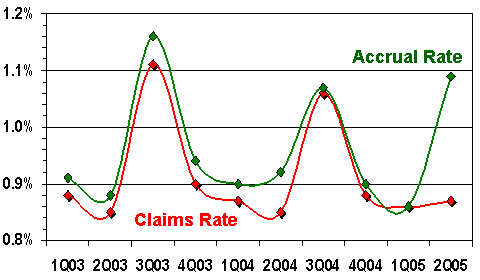
In Figure 1 below, the aggregate for 140 medical and scientific equipment manufacturers varies from 0.85% to 1.16%. In dollar amounts, it's ranged from $150 million in early 2003 to nearly $200 million in the most recent quarter. But because sales have also been growing, the claims rate as a percentage of sales has actually been below average for the past three quarters.
Figure 1
Medical & Scientific Equipment
Warranty Claims & Accrual Rates
First Quarter 2003 - Second Quarter 2005
Source: Warranty Week from SEC data
What becomes immediately apparent from the curves in Figure 1 is the variability of warranty claims and accrual rates within the medical and scientific category. As in the August 23 newsletter, we're stretching the vertical scale in these charts to exaggerate the highs and lows. But the humps would be hard to miss, even if we flattened out the scale.
Note also that the two humps are in the third quarters of 2003 and 2004, which suggests some kind of seasonal pattern. It's not timed to the end of the budget year, and the outdoor weather would not be much of a factor for indoor equipment. So we're at a loss to explain why, except to suggest that possibly it has something to do with the school calendar, teaching hospitals, incoming interns, university funding patterns, etc. If any readers have a better explanation, your input is solicited.
The other trend of note is the closeness of the two curves. As was mentioned in the August 23 newsletter, the distance between the red and the green lines is a measure of the skill of the accountants when it comes time to match actual warranty spending with projected future expenses. When the lines virtually overlap, it means the accountants are quick to make adjustments to their accrual rates when the claims rate changes. However, note also that while the accountants have done an excellent job for nine quarters, in the most recent quarter they finally goofed.
Or did they? We don't want to get ahead of ourselves, but take a peek if you like at Figure 10: the chart for Guidant Corp. The company may have single-handedly caused the whole industry's claims and accrual rates to diverge, thanks to a massive and unexpected product recall. Had this not happened, we believe the tenth quarter would also have seen a close match between claims and accruals. But it will be interesting to see if there's another seasonal spike in the third quarter of this year.
We ranked all 140 medical and scientific equipment makers based upon their reported amounts of claims paid for the first half of 2005. First among them was Agilent Technologies, the communications, test and measurement equipment, and semiconductor manufacturer that also has a major position within the life sciences and chemical analysis. Agilent has so far in 2005 reported $38 million in warranty claims, with $18 million spent in the first quarter and $20 million in the second quarter.
Figure 2
Agilent Technologies
Warranty Claims & Accrual Rates
First Quarter 2003 - Second Quarter 2005
Source: Warranty Week from SEC data
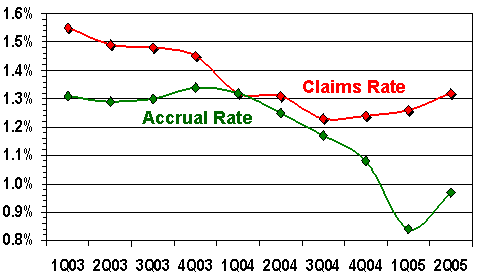
As the chart above shows, Agilent's claims rate slowly descended from 1.55% to 1.25% over eight quarters, before turning slightly upwards this year. Meanwhile, the accrual rate had declined more or less in parallel before plummeting on its own earlier this year. During the first quarter of 2005, Agilent made only $12 million in accruals on $1.432 billion in product sales -- an 0.8% rate. No reason for this rate change was included in the quarter's Form 10-Q filing. However, net income was up 45% to $103 million for the quarter and would have been up strongly even if the company had made its usual-sized warranty accrual, so nobody can accuse the company of manipulating accruals in order to "make its numbers."
Eastman Kodak shows the opposite trend. Accrual rates have gradually risen before falling back this year. Both claims and accruals show some seasonality with spikes in the first quarters of 2004 and 2005, but at least the claims rate seems to be oscillating around a trend line of 1.5%. One could therefore say that Kodak's equipment warranties cost the company roughly 1.5% of product revenue, though the company almost always puts a little extra away to pay for future claims.
Figure 3
Eastman Kodak
Warranty Claims & Accrual Rates
First Quarter 2003 - Second Quarter 2005
Source: Warranty Week from SEC data
Note also that during three out of ten quarters, Kodak has precisely matched claims to accruals. This doesn't really mean much, however, because there's always going to be a lag between sales and claims. Products sold today will generate claims some time in the future, even though the accruals set aside to pay those claims are theoretically made immediately after the sale. Therefore, what would be even more impressive than precise matches would be to see accruals rise and fall in anticipation of changes in the claims rate. We do in fact see that to a degree in Figure 3, with accruals inching upwards in the fourth quarters before claims rise in the first quarters.
Beckman Coulter makes a wide variety of equipment used for drug research, immunology, protein research, blood analysis, and molecular diagnostics. So far in 2005 it's reported $32.1 million in warranty claims -- enough to rank it third in the industry.
No Reason Given
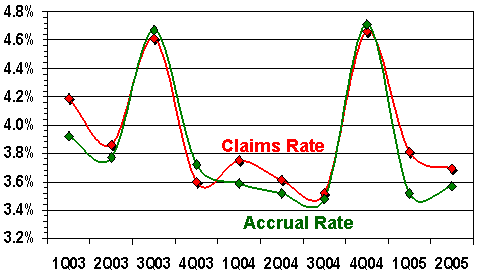
As the chart below illustrates, Beckman Coulter's claims and accruals are typically in a 3.5% to 4.2% range, though both rates have twice spiked above 4.6%. We can't conclude that there's a seasonal effect at work, because the first spike came during the summer and the second spike came during the fall.
Figure 4
Beckman Coulter
Warranty Claims & Accrual Rates
First Quarter 2003 - Second Quarter 2005
Source: Warranty Week from SEC data
The company's Form 10-Q for the third quarter of 2003 and its Form 10-K for 2004 are silent on the reasons behind these spikes. This is somewhat curious given the amount of time the company spends explaining changes in the amounts of money accrued for employee terminations, pensions, deferred service, installation, and training. One would think investors would demand information about why warranty claims jumped from $14 million to $23 million in consecutive quarters and then fell under $5 million in 2003, or why they soared from $14 million to nearly $37 million at the end of 2004. But all they'll find in Beckman Coulter's financial statements are the usual boilerplate phrases about "specific warranty matters when they become known."
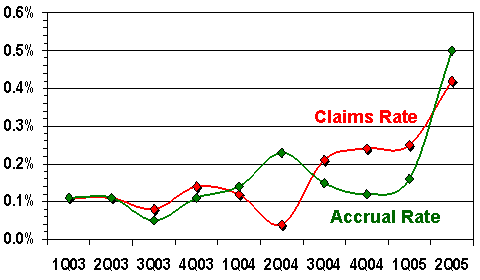
Pacemaker pioneer Medtronic, on the other hand, has displayed until recently some rather low warranty claims and accrual rates. While the industry averages 1%, Medtronic's pacemakers and other devices have remained close to 0.1%. And while they've spiked recently, they're still nowhere near the rates seen at Guidant Corp.
Figure 5
Medtronic Inc.
Warranty Claims & Accrual Rates
First Quarter 2003 - Second Quarter 2005
Source: Warranty Week from SEC data
Medtronic actually ends its fiscal year on April 29, so what we're counting here as the company's first and second calendar quarters of 2005 are actually the third and fourth quarters of its fiscal year. However, Medtronic reported only $42.7 million in claims on more than $10 billion in sales during that fiscal year, so its claims rate remains low. The only caveat we have is that the company does not break out sales of consumables or services, so the core revenue of warranted manufactured products may in fact be much less than $10 billion. The company does a good job of dividing up its revenue into cardiac, spinal, diabetes, and other treatment areas, but it doesn't separate durable from consumable or product from service.
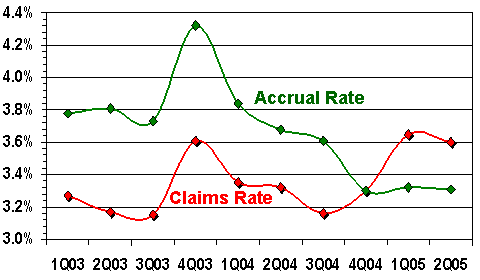
Varian Medical Systems, like Beckman Coulter and a handful of other medical manufacturers, reports warranty claims rates that are unusually high for their industry. These rates may be normal for the X-ray equipment and cancer/radiation treatment systems made by the company, but we're not used to seeing rates above 3% or 4% outside of the computer and automotive industries. Keep in mind that 1.6% to 1.8% has been the average range for all manufacturers for the past ten quarters.
Figure 6
Varian Medical Systems
Warranty Claims & Accrual Rates
First Quarter 2003 - Second Quarter 2005
Source: Warranty Week from SEC data
Note how Varian's the shape of accrual rate rather precisely mirrored its claims rate for seven quarters, albeit at a slightly higher percentage. During the fourth quarter of 2004 the rates were the same, and so far this year the rates have reversed places. in fact, it was precisely when the red and green lines intersected that the company's warranty reserve fund balance peaked at $40.7 million. It had been growing all through 2003 and 2004, and has been shrinking so far this year.
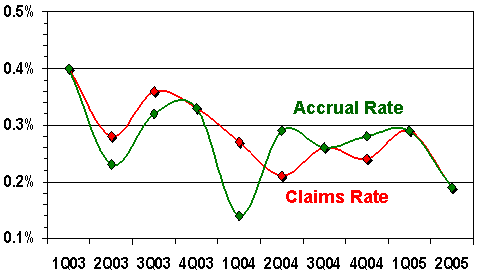
Baxter International, we suspect, sells a significant amount of consumable products that don't generate any warranty expenses. Its financial statements, however, segment the product line into rather broad categories such as medication delivery, bioscience, and renal, without making clear which are consumable or durable products, or which are services. Elsewhere, 52% of revenue is listed as coming from recombinants, plasma proteins, peritoneal dialysis therapies, and IV therapies such as intravenous solutions and nutritional products. If one were to assume all of those to be consumables sold without warranties, then Baxter's true claims rate could be more than twice the amount computed in the chart below.
Figure 7
Baxter International
Warranty Claims & Accrual Rates
First Quarter 2003 - Second Quarter 2005
Source: Warranty Week from SEC data
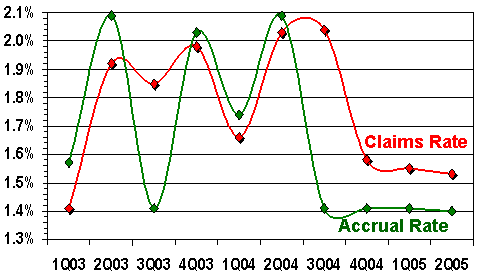
Applera Corp., depicted in Figure 8, has two lines of business: one that makes equipment used for DNA, protein, and molecular analysis, and another that performs research on cancer, autoimmune and inflammatory diseases. Years ago it was known as Perkin Elmer Corp.
The chart below was made possible only because the company filed its annual report with the SEC last Thursday, September 8. For the industry totals in the Sept. 7 newsletter we had estimated Applera's fourth quarter warranty spending, and we actually came close to the $6.0 million in claims and $5.6 million in accruals reported last week. But there are no estimates in the chart below.
Figure 8
Applera Corp.
Warranty Claims & Accrual Rates
First Quarter 2003 - Second Quarter 2005
Source: Warranty Week from SEC data
Furthermore, Applera always includes separate figures for products and services; instruments and consumables. Thought both its claims and accrual rates seem to oscillate significantly between 1.4% and 2.1%, what we may be seeing here is something approaching a true measure of claims and accruals matched against only warranted product revenue. In other words, it may be variable, but at least it's actual. If all the consumable and service revenue were peeled away from the other manufacturers, this might also be the range of their true claims and accrual rates. And the last three quarters at Applera haven't been variable at all, suggesting that whatever trend was causing the 180-day sine wave has ended.
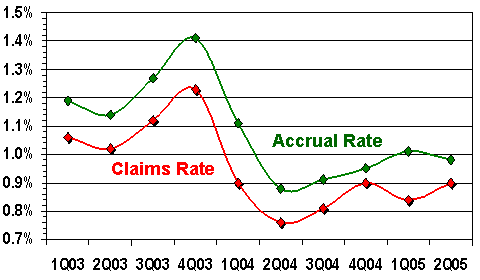
Thermo Electron Corp., makers of mass spectrometers and other analytical instruments used for everything from gasoline production to water purification, has seen its warranty claims rate vary significantly over the past two and a half years. Its claims rate was never below 0.9% of sales during the first five quarters of the period, and for the most recent five quarters it's never been higher than 0.9%.
Figure 9
Thermo Electron Corp.
Warranty Claims & Accrual Rates
First Quarter 2003 - Second Quarter 2005
Source: Warranty Week from SEC data
We should note that while the company segments its revenue into 1) life and laboratory sciences and 2) measurement and control, both segments include warranted product lines and presumably, also include some services and consumables. At no point does the company offer any information at this level, so we've been forced to use 100% of the total in our claims and accrual rate calculations.
Guidant's Pacemaker Problem
What Guidant euphemistically calls its "voluntary physician communications" are in reality a massive product recall instigated by news that the company's pacemaker and defibrillator product have been failing due to alleged manufacturing defects. We have to be careful here, because these questions are likely to be answered only after lengthy and complex court proceedings, in which we want to have no role.
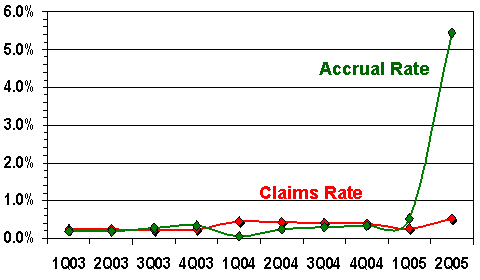
What we can say for certain is that Guidant had been putting aside as much as 0.6% of revenue and as little as 0.2% of revenue to cover future warranty claims when all of a sudden during the second quarter of 2005 the company felt the need to put aside $99.8 million in warranty accruals. That's roughly 20 times what it put aside during the first quarter, and it had the effect of increasing its warranty reserve from the $19 to $23 million range all the way up to $115 million.
Figure 10
Guidant Corp.
Warranty Claims & Accrual Rates
First Quarter 2003 - Second Quarter 2005
Source: Warranty Week from SEC data
The company's manufacturing crisis manifests itself in the sudden rise of the green line in Figure 10 from 0.5% to 5.4%. It has yet to show up in the claims rate, but remember that the bad news didn't begin arriving until the end of June and didn't really become dire until August. Even for a company that's averaging $900 million in sales per quarter, an emergency hundred-million-dollar addition to the warranty reserve fund is a significant event.
To its credit, even with all the euphemisms it uses for the product failures and recalls, Guidant has included hard details in its financial statements about the specific warranty claims and accruals related to them, in addition to details about write-downs of now-unsellable inventory. Undoubtedly, more hard numbers will be included in the company's third quarter financial statement, expected in November.
Finally, the tenth largest warranty provider in the medical and scientific category is Coherent Inc., a company whose optical data storage, semiconductor test and measurement, and other laser equipment would seem to be more at home in another category. Last week, in fact, we counted the company in the semiconductor category. But it also makes lasers used in spectrographic devices, spectroscopic equipment, and commercial, industrial and medical research.
Figure 11
Coherent Inc.
Warranty Claims & Accrual Rates
First Quarter 2003 - Second Quarter 2005
Source: Warranty Week from SEC data
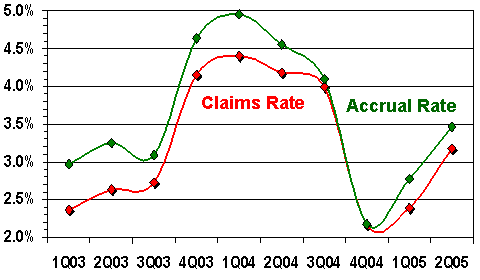
Unfortunately, the company does not identify the percentage of its revenue arising from services, so we can't be sure if its externally-observed claims and accrual rates are in fact correct. But even when using 100% of the company's revenue in these calculations, we're finding a significant range of 2.2% to 5%. Coherent's most recent financial statement does make numerous mentions of changes in warranty costs, but they refer to "lower warranty costs due to improving quality," which we are at a loss to find evidence of in these numbers. Yes, it's better than it was a year ago, but that seems to have been at the tail end of an unexplained 12-month-long spike.
Overlooked Data Hiding in Plain Sight
There are 130 more companies in this category, but you get the point. It really takes a headline-generating manufacturing crisis to prompt a company to include anything above the most generic language regarding warranty spending. For seven or eight of these ten companies, this newsletter might be the first and only graphical representation ever published about their warranty expenditures. Yet all this information is in the public domain and has been for the past 30 months. It wasn't until a subscriber noted that we've never written about medical equipment that we even attempted to put together a top ten for this industry.
We can't say why some of these companies' warranty expenses are gyrating so noticeably, but while we can't say, they simply won't say. In their boilerplate phrases they say their accruals are appropriate and are based on historical rates, while the math suggests otherwise. And while they detail the ups and downs of many other types of expenses such as health care and pensions, they have little or nothing to say about the cause of highly-variable warranty claims rates, which might in fact have much to do with product quality, reliability, brand image, and ultimately, customer satisfaction and perhaps even legal costs.
| Back to Part Three |


