

Telecom Equipment Warranties:
Unlike in other industries, there doesn't seem to be any typical spending rate for warranty claims in the phone, data, wireless, or broadcast equipment sectors. For every high there's a low, and for every upward trend there's a decline.
The big theme among the 140 or so U.S.-based manufacturers of telecommunications equipment who disclose their warranty expenses is volatility. Of all the manufacturers who have seen radical changes in their warranty claims rates over the past three years, most are part of the telecommunications industry.
It probably has something to do with sales, and specifically with the volatility of equipment sales in an industry that has been through massive breakups, consolidations, and bankruptcies in just the past few years. Add to that the turmoil of technology changes and collapsing costs per minute or per megabyte and it's easy to understand how warranty claims rates can rise and fall so quickly.
To conclude our third full year of publishing Warranty Week, we're going to take a look at 140 telecom equipment makers in much the same way we did the semiconductor equipment makers two weeks ago and the auto parts suppliers last week. That means we're going to assume that most of the warranties are issued by one business to another business, unlike in the appliance, auto, or computer businesses where most of the end users are residential or office-based.
In this case, however, it doesn't seem to change the warranty picture very much. In industries such as semiconductors and auto parts, the component suppliers seem to get away with lower warranty expenses than the manufacturers of the final products. And in semiconductors in particular, the makers of the production platforms seem to end up with higher warranty expenses than the products actually produced on them.
No Clear Trends
There doesn't seem to be any such generalities to be made in telecom equipment. There are manufacturers with high OEM-like warranty claims rates and there are manufacturers with low supplier-like rates. There are highs and lows in both voice and data communications. And there are highs and lows in each of the other sub-sectors such as broadcasting, wireless, satellite, and microwave.
First, let's look at the industry as a whole. Together, the 140 manufacturers represented in Figure 1 represent around 5% of the entire warranty pie. These companies have reported just over $1.1 in warranty claims during the first nine months of 2005, an amount which is actually down 10% from the same period in 2004. In fact, as the chart below illustrates, telecom equipment warranty claims were on a steady climb until the final quarter of 2004, when they hit a high of $442 million. They've been falling ever since.
Figure 1
Top U.S.-based Telecom Equipment Makers
Product Warranty Claims
in $ Millions per Quarter
1Q 2003 to 3Q 2005
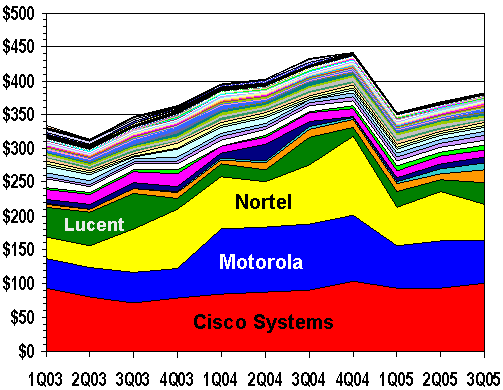
Source: Warranty Week from SEC data
The reason for the decline also is clear from the data in Figure 1. Nortel Networks reported a radical decline in its warranty spending in 2005 which have not been offset by increases at other companies. Nortel reported warranty claims of $117 million in the final quarter of 2004 -- an amount which is actually a record for a telecom equipment manufacturer. It represented what we estimate to be 4.4% of the company's equipment revenue, after we deducted 20% of total revenue to account for services which otherwise were not broken out separately.
Of course, one company's warranty claims rate cannot be directly compared to another's. Different companies may include different lists of indirect expenses. For instance, one might attribute a portion of training costs to warranty while another may not. One company might count nothing but payments while another might include a portion of call center costs, postage and shipping, and computer network costs.
Towards the High End
That having been said, Nortel's 4.4% is not only a high for the company. It's also towards the top of the stack in the telecom industry. Of the three quarterly reports by each of 140 companies (for a total of 420 data points) seen so far this year, only seven have reported claims totals which turned out to be over 4% of product sales. The "winner," by the way, was Broadwing Corp., a telephone manufacturer which reported $1.16 million in claims on $13.9 million in sales, for an 8.3% claims rate. The company has wisely decided since then to discontinue reporting its warranty expenses altogether, which because of radical declines in equipment sales, have probably pierced the 100% mark by now.
The four largest telecom warranty providers in the chart above are labeled. Those for whom labels wouldn't fit include UTStarcom Inc. (orange); Andrew Corp. (teal); Juniper Networks Inc. (navy blue); Avaya Inc. (pink); Tellabs Inc. (bright green); and 3Com Corp. (white). And then there are another 130 manufacturers whose warranty expenses collectively are about the same size as those of Cisco, Motorola or Nortel.
The Nortel anomaly is much clearer in Figure 2 below. Back in early 2003 the company was reporting warranty expenses closer to 1.7% of equipment sales. In 2004 expenses were in a range of 3.5% to 4.4%. And then in 2005, after some accounting problems were behind them, the company brought its warranty expenses below 3% once again.
Figure 2
Nortel Networks Corp.
Warranty Claims & Accruals
in % of Sales & $mil per Quarter
1Q 2003 to 3Q 2005
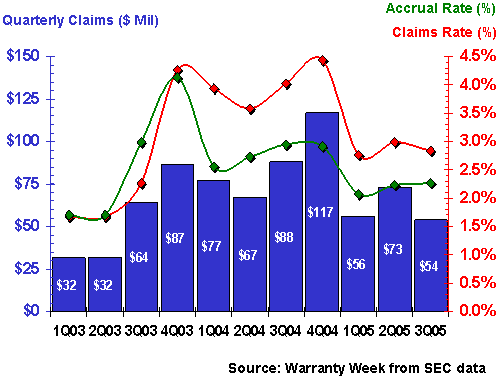
Figure 2 also illustrates the story of telecom warranty volatility quite well. Be it claims measured in dollars or percent, the distance between Nortel's high and low quarters of the past three years is quite wide. And the only reason the rates in percentages have once again subsided is that sales have picked up in 2005. Claims in dollars are about the same in 2005 as in 2004.
Another story of volatility -- in the opposite direction -- comes from Lucent Technologies. As seen in Figure 3, the company started 2003 with a claims payout rate near 3.5% or 3.6% of product sales. Then in the fourth quarter of 2003, warranty claims took a sudden and seemingly permanent fall, down to a range of 0.7% to 1.3%. Even in dollar terms, claims have stayed low except for the twin spikes of the third quarters of 2004 and 2005 (which correspond to the end of Lucent's fiscal year).
Figure 3
Lucent Technologies Inc.
Warranty Claims & Accruals
in % of Sales & $mil per Quarter
1Q 2003 to 3Q 2005
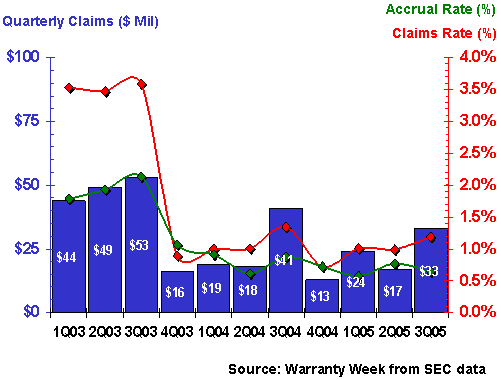
Claims always seem to rise during the final quarter of any fiscal year, as if the manufacturer is clearing the deck. In Lucent's case, the fourth quarter of the fiscal year ended September 30, 2005 represented 38% of the year's total. In 2004, the same quarter represented 44% of the fiscal year's total. Among all manufacturers, the fourth calendar quarter last year represented close to 27% of the year's total. We shall soon see if that phenomenon repeats in 2005.
Nortel and Lucent are the two titans of the telecom carrier equipment industry. Except for the wares of a few European manufacturers, most of the world's telephone networks are run on the telco switches made by these companies. While there are some differences in their product lines, there is no easy explanation for the difference in their warranty claims rates.
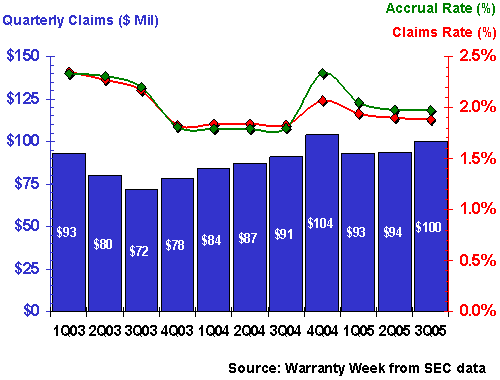
It's the same story on the data communications side of the house. Cisco Systems, which has rode the Internet wave to become a telecom equipment giant, has consistently reported warranty claims rates close to 2% of product sales. Meanwhile, 3Com, which is best-known for its local-area networking products, has seen claims rates consistently sticking closer to 5%.
Figure 4
Cisco Systems Inc.
Warranty Claims & Accruals
in % of Sales & $mil per Quarter
1Q 2003 to 3Q 2005
It's noteworthy to report that data communications vendors represent four of the seven companies who've seen claims rates go over 4% of sales during any portion of 2005. Voice equipment vendors had two slots, and only one broadcasting vendor made the cut. Ironically, one of the over-4% companies competes with Cisco. Another is a supplier to Nortel (as well as a retail brand name in its own right).
Conversely, there are 35 telecom equipment makers who have reported claims totals at least once during 2005 that represented 1% or less of their total sales. Among those who've done it consistently are SPX Corp., Andrew Corp., and Broadcom Corp. And while the first two are in the specialized businesses of antennae and towers, the latter is squarely in the consumer-oriented cable modem and DSL industry segments. So by all rights, as with the consumer-facing automakers and appliance companies, their claims rates should be much higher.
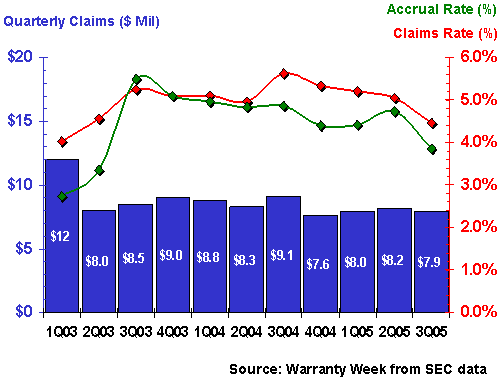
Finally, in Figure 5 we see an example of a company which has consistently been paying out over 4% of sales to satisfy warranty claims for the past three years. But unlike Nortel, 3Com went over 4% and stayed there. However, even here there's a silver lining. A year ago, claims topped 5.6% of sales. Now they're below 4.5%. Even in dollar terms, claims are down 13% from the $9.1 million reported in last year's third quarter.
Figure 5
3Com Corp.
Warranty Claims & Accruals
in % of Sales & $mil per Quarter
1Q 2003 to 3Q 2005
So there you have it: a mini-report on warranty in the telecom industry. There doesn't seem to be any trend to speak of. Some telephone equipment companies have high claims rates. Some have low claims rates. It's the same story in the data communications and broadcasting segments. Sorry to say, but there is simply no such thing as a "typical" warranty claims profile for a telecom equipment manufacturer.
| Back to Part Six | Go to Part Eight |
This is the final Warranty Week column of 2005. It's being delivered by email to some 3,300 recipients in 52 countries, including some to which your editor cannot legally travel using an American passport. It is likely to be downloaded by a further 10,000 to 12,000 Web readers in the coming weeks, if past traffic patterns hold true.
In a media world where less than half of all new publications get to celebrate their first birthday, it is a wonderful gift from you our readers for us to be in a position to celebrate our third. It was towards the end of November 2002 when we sent out that first tentative column to a few dozen warranty professionals. Now it takes a full nine hours to complete the overnight email broadcast.
Thank you all for helping spread the word. While many readers find Warranty Week somewhat accidentally while searching the Web for something else, many others are sent our way by the recommendations of current readers. We are in your continued debt, and we can only hope we continue to provide content you think is worth passing on.
We're taking off next Tuesday to celebrate Christmas and Hanukkah, and we're taking off January 3rd to mark the start of the new year. Warranty Week will return in three weeks with a column scheduled for publication on January 10, 2005. Until then, please allow us to extend our wishes to all of you for a happy holiday and a peaceful and prosperous new year.