

Top 50 Warranty Providers:
While most large manufacturers saw warranty claims rise in 2005, most also saw sales gains that helped relieve the pain. Even GM and Ford saw only modest upticks in the percentage of sales they pay in claims. And some such as Boeing saw claims plummet.
Warranty costs increased for most large American manufacturers last year, measured in both dollars spent and as a percentage of sales. The top 50 U.S.-based warranty providers together reported $22.2 billion in warranty claims last year, up from $20.4 billion in 2004 and $19.2 billion in 2003.
These 50 manufacturers and retailers, ranked by the dollar amount reported in warranty claims during 2005, are the largest among more than 700 publicly-held and American-based companies who now report their warranty expenditures in their Form 10-K annual reports. Together these top 50 represent roughly 82% of the total warranty claims reported to the U.S. Securities and Exchange Commission by all public companies last year. Once all the Form 10-K reports have been filed, Warranty Week expects the 2005 total for all manufacturers to top $27 billion in claims.
We're still waiting for annual reports from Navistar, Delphi, and Nortel Networks, the contents of which may alter these totals somewhat. But the other tardy annual report filer, General Motors, made its end of March deadline and so is included here. GM and Ford together spent $8.7 billion on 2005 claims, up from $8.3 billion in 2004 and $8 billion in 2003. But measured as a percentage of auto sales, their claims rate was up only fractionally.
Percentage of Sales
The billion-dollar figures sound large -- and they are -- but the more important measure of warranty costs is as a percentage of sales. GM spent 3% of its auto sales revenue fixing vehicles under warranty last year. Ford spent 2.6%. For each company, that's an increase of a tenth of a percentage point from 2004. So while the story with recalls may be different, the automakers' warranty story has featured only slight increases in costs.
Of the top 50 warranty providers, 18 saw the percentage of sales they pay in warranty claims fall during 2005. The other 32 saw increases since 2004. However, only 22 of the 50 have seen their claims rates increase since 2003. Over time, the claims rate provides a very good baseline against which a company's latest results can be compared. While one company can't be compared to another, a company can be compared to itself, as long as the metrics of warranty claims and product sales are held constant.
There are exceptions to that rule, however. For instance, on the chart below GE is measured with a 75% decline in its warranty claims rate. Claims in dollars were down only 17% from 2004 to 2005. But because of acquisitions GE made in the medical field, and because of changes in the way revenue is reported by the business units that include turbine sales, the denominator in the fraction that computes GE's claims rate more than tripled, from $17 to $57 billion. Therefore the claims rate fell by more than three-quarters, at least on paper. It's a statistical aberration, nothing more.
For Boeing, however, claims really did plummet, both in dollars and as a percentage of sales. In 2004 Boeing paid out $252 million, representing 1.2% of its commercial aircraft sales revenue. Last year, it paid out only $146 million, or only 0.6% of commercial sales. As the chart below illustrates, claims remained in a tight 1.1% to 1.3% range for two years but then promptly fell to a 0.6%-0.7% level last year. Claims per quarter in dollar terms fell from a $60-$80 million range to $30-$40 million last year. It really was a sudden and sustained decline in warranty costs, and what makes it all the more remarkable is that this may be the first paragraph ever written about it.
Figure 1
Boeing's Warranty Claims
In % of Sales and $ mil per Quarter
2003 to 2005
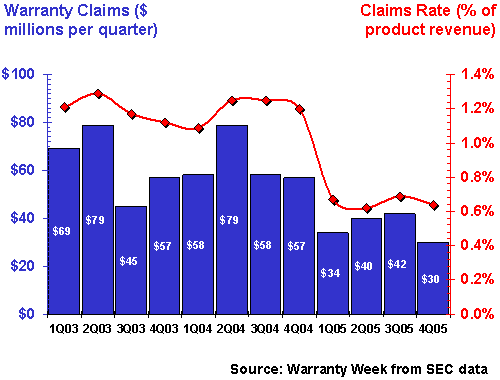
Warranty Week tracks the claims histories of some 736 manufacturers, and in the weeks ahead we'll detail many more unexpected and unheralded changes in warranty costs. For all manufacturers, the historical average has been around 1.8% of sales paid out in claims, so Boeing as a company has been lower than average for several years. But still, it is not common for a company to cut its claims rate by such a high proportion in only a year. Lucent did it in 2004, and it similarly shunned the publicity -- wisely, in fact, because its rates are now creeping back up just in time for the merger with Alcatel.
Mergers and Acquisitions
Other mergers and acquisitions had their effect elsewhere in the warranty data below. The Jarden Corp., for instance, wasn't even in the top 500 a year ago, before it acquired the Coleman and Sunbeam brand names, among others. Johnson Controls acquired York International in December, and saw its warranty claims rate rise by 40% for the year as its product mix grew to include the company's HVAC equipment. Whirlpool and Maytag didn't seal their merger until this year, however, so both appliance manufacturers are on the top 50 list this one last time. From this point forward in 2006, the two companies are likely to combine their warranty accounts.
In the table below, the second column tallies each manufacturer's warranty claims paid in 2005 dollars. The third column expresses claims as a percentage of sales, as observed at the end of 2005 (or at the end of the fiscal quarter that ended in October, November, or December 2005). The fourth column compares that percentage to the end of 2004 percentage (except in the cases of Delphi, Jarden, Navistar and Nortel -- see footnotes). Negative percentages represent reductions in warranty cost, so those near the top of the list are showing the most improvement.
Figure 2
Top 50 U.S.-based Warranty Providers of 2005
Improvement in Claims Rates vs. 2004
(in $ millions and percent)
| Warranty | Claims as | Change | |
| Claims | Pct of | Since | |
| Company | 2005 | Prod Sales | 2004 |
| General Electric Co. | $699m | 1.2% | -75% |
| Nortel Networks | $227m | 2.1% | -53% |
| Boeing Co. | $146m | 0.6% | -46% |
| Honeywell International | $172m | 0.7% | -27% |
| Tyco International Ltd. | $119m | 0.3% | -23% |
| Lennar Corp. | $149m | 1.2% | -21% |
| Eaton Corp. | $87m | 0.8% | -18% |
| Paccar Inc. | $228m | 1.7% | -15% |
| Cisco Systems Inc. | $387m | 1.8% | -12% |
| Brunswick Corp. | $112m | 2.3% | -11% |
| American Standard Cos. | $144m | 1.5% | -11% |
| Hewlett-Packard Co. | $2353m | 3.4% | -7.5% |
| United Technologies Corp. | $459m | 1.5% | -7.1% |
| Jarden Corp. (2) | $72m | 2.9% | -4.8% |
| Sun Microsystems Inc. | $341m | 4.7% | -2.9% |
| Maxtor Corp. | $190m | 4.9% | -2.4% |
| Eastman Kodak Co. | $79m | 1.4% | -1.7% |
| Black & Decker Corp. | $111m | 1.7% | -0.2% |
| Textron Inc. | $149m | 1.6% | +1.0% |
| Whirlpool Corp. | $294m | 2.6% | +2.2% |
| Ingersoll-Rand Co. Ltd. | $85m | 0.9% | +2.5% |
| Ford Motor Co. | $3986m | 2.6% | +3.4% |
| EMC Corp. | $102m | 1.4% | +3.7% |
| General Motors Corp. | $4696m | 3.0% | +4.1% |
| Maytag Corp. | $135m | 3.1% | +7.3% |
| Deere & Co. | $453m | 2.3% | +9.2% |
| Caterpillar Inc. | $712m | 2.1% | +11% |
| Pulte Homes Inc. | $129m | 0.9% | +11% |
| Remy International Inc. | $55m | 4.5% | +11% |
| Danaher Corp. | $85m | 1.1% | +12% |
| Navistar International (1) | $264m | 2.4% | +14% |
| Fleetwood Enterprises Inc. | $91m | 3.5% | +15% |
| Masco Corp. | $57m | 0.6% | +15% |
| Seagate Technology | $115m | 1.7% | +16% |
| Lexmark International Inc. | $172m | 9.6% | +17% |
| Palm Inc. | $80m | 5.2% | +18% |
| Cummins Inc. | $236m | 2.4% | +19% |
| Dell Inc. | $1521m | 3.8% | +24% |
| AGCO Corp. | $128m | 2.4% | +27% |
| Novellus Systems Inc. | $85m | 6.3% | +28% |
| IBM Corp. | $831m | 3.4% | +33% |
| Apple Computer Inc. | $230m | 1.6% | +38% |
| Johnson Controls Inc. | $55m | 0.3% | +40% |
| Delphi Corp. (1) | $163m | 0.6% | +40% |
| Applied Materials Inc. | $198m | 2.8% | +49% |
| Agilent Technologies Inc. | $78m | 1.9% | +50% |
| Motorola Inc. | $716m | 1.9% | +55% |
| Medtronic Inc. | $58m | 0.5% | +107% |
| Lucent Technologies Inc. | $103m | 1.9% | +169% |
| Guidant Corp. | $66m | 1.9% | +369% |
Source: Warranty Week from SEC data
Footnotes:
(1) Delphi, Navistar, and Nortel Networks have not yet filed their year-end 2005 financial reports, so full-year estimates were extrapolated based on third quarter data. Also, annual comparisons were made using Sep. 30, 2004 and Sep. 30, 2005 data.
(2) Jarden Corp. last year acquired both the Holmes Group and American Household, along with their respective warranty reserves. On its own, Jarden was not a significant warranty provider at the end of 2004, so rather than annual comparisons, percentages were calculated using March 31, 2005 and Dec. 31, 2005 data.
Statistics were gathered for each of 736 warranty providing companies from their three quarterly statements and one annual report filed with the SEC. All were for periods ending in calendar 2005. In cases where a company's fiscal year ended on a date different from Dec. 31, the four fiscal quarters which ended during 2005 were used. For instance, any fiscal quarter ending during the months of October, November, or December was considered for the purposes of this study to be the fourth quarter of calendar 2005.
The 736 companies were then ranked based on the dollar amount of warranty claims paid during calendar 2005. These top 50 warranty providers reported totals ranging from General Motors' $4.7 billion to Remy International's $55.3 million. All public companies which ended their fiscal years on Dec. 31 were required to file their Form 10-K annual reports with the SEC by the end of March. GM was among the last of the large companies to file this year, thanks to some last-minute revisions in its net loss computations. Delphi, Navistar, and Nortel Networks were among the dozen or so companies that completely missed the deadline. For them, we have fashioned placeholder estimates for the time being.
As soon as the missing data becomes available, we'll revise these totals and percentages. Manufacturers traditionally report more warranty costs in their fourth fiscal quarters than in any other, so it's unlikely that Nortel Networks will remain third on the list once it files its year-end report. Then again, Nortel is coming off some fairly steep year-ago numbers, so some improvement (and therefore a negative percentage change) is highly likely.
Computer Service Revisions
There are a few other changes in methodologies and the use of estimates to report. Most notably, we revised the estimate for the percentage of Dell's sales revenue that comes from services, finance, and other non-warranted sources up to 22%. We had previously estimated that the non-warranted segment was roughly the same size as Apple Computer's, at 14%. For HP, non-warranted revenue represent 20% of total revenue. At Cisco it's 16%. At GM it's 18%. So we're estimating that Dell is a little ahead of its peers, primarily because of its success selling extended warranties.
What this change of estimate does, however, is raise Dell's claims rate above those reported by HP and IBM. It used to be lower, because we were underestimating the contribution of services to Dell's top line. We also revised Dell's estimates retroactively, however, so the 24% rise in claims rates over the past year is accurate. So is the 33% rise for IBM. Despite Lenovo's acquisition of the PC business, which one would expect to have been more warranty-weighted than the remaining lines of business, IBM is paying out more as a percentage of sales now than it did a year ago (3.4% vs. 2.6%). And no doubt because of the iPod's battery problems, Apple Computer is up 38% from a year ago. At HP, meanwhile, warranty costs slid from 3.7% to 3.4%. For a ship as big as HP, that's an astonishing turn.
An increase in sales can be just as beneficial as a decrease in warranty costs when it comes time to compute a claims rate, of course. In effect, we're comparing the repair costs for old products against the sales revenue for new products. And in fact, all but one of the companies that showed a declining claims rate also saw sales rise (the sole exception being Tyco International). Among the 38 who saw their claims rates rise, ten can partly attribute it to declining sales totals. However, the rest have no excuse. For instance, Pulte Homes saw sales rise 29% while warranty costs rose 43%, which together produced an 11% rise in its claims rate. Caterpillar saw a 20% increase in sales and a 33% rise in claims, and together those measures also produced an 11% rise in the claims rate.
Medical Surprises
At the extreme bottom of the chart, Guidant Corp. continues to be impacted by the cost of its pacemaker recall. The company went from $9 million in warranty claims in 2003 to $15 million in 2004 and $66 million in 2005. So of course the percentages were up by an insane amount. It was the same story for Medtronic Inc., which saw claims soar from $10 to $14 to $58 million in the past three calendar years. It sounds less serious when seen as a 0.1% to 0.2% to 0.5% of sales rise, however.
Not all the manufacturers who saw triple-digit rises in claims rates were making medical devices, however. At Lucent Technologies, the 169% increase has a little to do with rising warranty claims and a little to do with falling sales. This is a situation where a picture really is worth a thousand words.
Figure 3
Lucent's Warranty Claims
In % of Sales and $ mil per Quarter
2003 to 2005
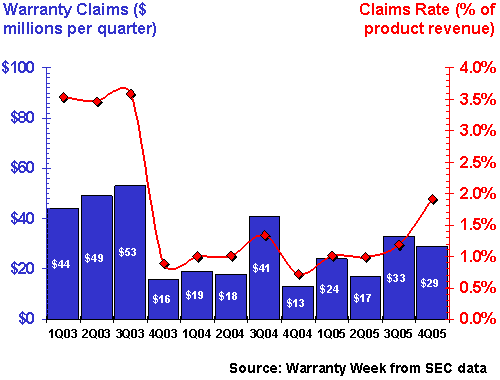
As the chart shows, it just so happens that Lucent's claims rate hit its three-year low of 0.7% at the end of 2004, and its nine-quarter high of 1.9% at the end of 2005. That's a 169% rise, and it puts Lucent above the all-manufacturer median for the first time since 2003. So perhaps it's better the decline went unpublicized. There will be less questions to answer now on the inevitable rebound, and after the merger is completed Lucent's warranty costs will blend into Alcatel's.
It will be much like what happened when Chrysler merged with Daimler Benz. Detroit used to have a big three, but at least in warranty terms, it's now a big two. DaimlerChrysler AG is not based in Detroit, any more than Toyota is a Kentucky company or Honda is from Ohio. They're all huge manufacturers, but financially they're based abroad. And therefore, along with Sony, Siemens, Nokia, and many other huge international manufacturers, they're not part of this U.S.-only list.
So don't look too surprised when you read somewhere that DaimlerChrysler last year reported almost as much in warranty claims as GM and HP combined: $6.9 billion, give or take, depending on the exchange rate you use for the U.S. dollar. That was around 4.2% of their auto sales revenue, and was significantly above 2003 and 2004 levels. Yet they seem to be doing fine -- certainly having none of the drama of GM and Delphi, not to mention the medical device companies.
In next week's newsletter we'll take a much closer look at the automotive industry's warranty experience over the past three years. But with seven major automotive OEMs and eight major parts suppliers on the list above, the highlights are essentially already here. It's the same story for computers, telecom equipment, disk drives, printers, and other peripherals: the major players are all on this chart. So maybe in future weeks we should do something besides dwell on changes in warranty claims rates? Suggestions are welcome.
| Go to Part Two |