Computer & Electronics Warranties:
As is the case in automotive, those with their brand names on the outside end up paying most of the warranty claims. But the computer OEMs don't pay out as much as some of the printer companies or the makers of high-end semiconductor production equipment.
Computer makers are a lot like car manufacturers. In the automobile industry, the owner of the brand name on the vehicle pays most of the warranty expenses. The same thing happens in the computer industry. Dell, Hewlett-Packard, IBM, Apple and the other "nameplates" pay out an average of 3.5% of their hardware revenue to satisfy warranty claims, more or less.
Meanwhile, their suppliers typically pay only 1% or 2% of their revenues for warranty claims, whether they're making data communications equipment or disk drives. It's a trend that has continued for at least the past three years, ever since U.S. manufacturers first began reporting their warranty expenses to the Securities and Exchange Commission. And with this amount of data, it's now possible to plot a baseline for specific industry segments and in some cases, specific product types.
In the auto industry, the OEMs typically pay out 2.5% to 2.7% of their revenue to honor warranty claims, while their suppliers average only 0.5% to 0.7%. Midway between these two extremes fall the manufacturers of drivetrain components such as transmissions and engines. As was detailed in last week's newsletter, manufacturers such as Cummins, Eaton, ArvinMeritor, and Dana are typically found in that middle ground, in a 1.0% to 1.5% range.
The Computer Warranty Chain
It's much the same story with computers and associated electronics. The brand names are at the top of the food chain, with HP and IBM paying out 3.4% of product revenue, Sun Microsystems at 4.7%, and Dell paying out an estimated 3.8% of its hardware revenue to satisfy warranty claims. One notch down are the disk drive manufacturers, who pay out anywhere between 1.5% and 2.5% of product revenue for warranty claims. Then down at the bottom are the manufacturers of semiconductors, printed circuit boards, and peripherals, who rarely if ever pay out more than 1.5% of revenue for warranty claims.
Warranty Week made a list of 600 electronics manufacturers -- makers of everything from office computers to scientific instruments -- and divided them into six categories: Computer OEMs, Data Storage, Telecom Equipment, Semiconductors & Printed Circuit Boards, Computer Peripherals, and Medical & Scientific Equipment. Each category contained between 15 and 124 companies, with some but not many duplications among them.
The Computer OEM category held the fewest companies but generated the most warranty expense. These 15 companies reported $5.4 billion in warranty claims last year, up 11% from 2004 levels. However, sales must have grown at a similar rate, because claims stayed more or less frozen at or around the 3.5% level, as the chart below illustrates.
Figure 1
Computer OEM Warranty Claims
In % of Sales and $ mil per Quarter
2003 to 2005
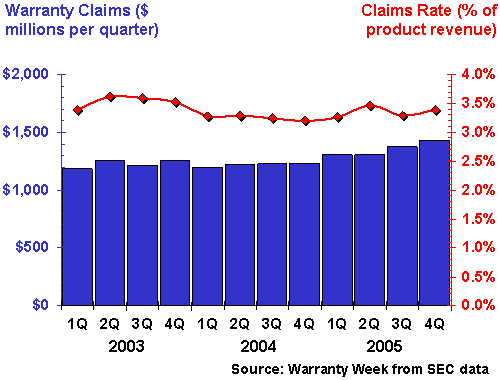
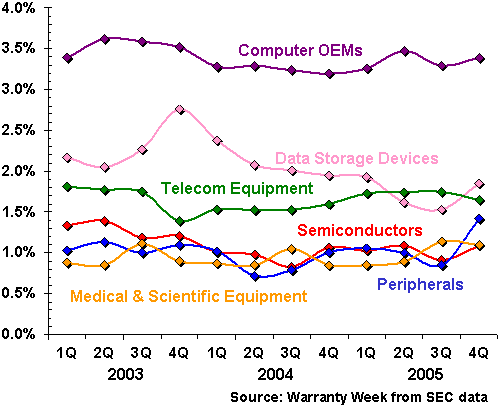
While individual manufacturers saw their warranty claims rates rise and fall, computer manufacturers as a group have remained within a very tight range of 3.2% to 3.6% over the past 12 quarters. Just as automotive OEMs have stayed within that tight 2.5% to 2.7% range, so too have computer OEMs remained within their bounds. With three years of data to support it, we're going to declare these ranges to be the "signature" rates of warranty expense for computers and vehicles. Anything within these ranges is normal and predictable. Anything outside these ranges is unusual.
Continuing the parallel, the drivetrain manufacturers of the computer world must be the data storage companies. Led by companies such as Maxtor, Seagate Technology, EMC, and Western Digital, these companies have as a group seen their claims rates decline from just above 2% to just below 2%. In fact, except for a spike at the end of 2003, they've always remained as a group within a 1.5% to 2.3% range -- not as tight as the OEMs, but still rather flat.
Figure 2
Data Storage Device Warranty Claims
In % of Sales and $ mil per Quarter
2003 to 2005
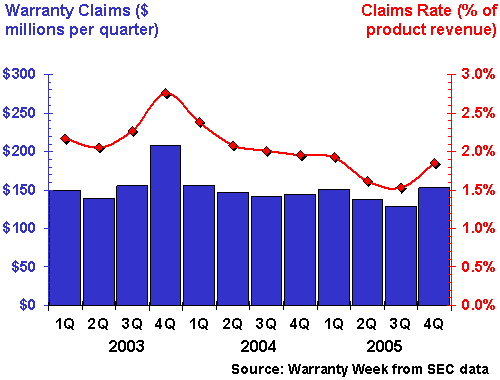
As a group, data storage device manufacturers paid out $571 million in warranty claims last year, down 3.2% from 2004. After dipping to a new low of 1.5% at midyear, claims rates for this group rose at year's end to 1.9%. But that's still a lower claims rate than any quarter in either 2003 or 2004.
Individual data storage manufacturers are all over the map. Maxtor is up at 4.9% while Western Digital is down at 0.9%. But it all evens out in the end, to a remarkably consistent "signature" range of 1.5% to 2.3%. As Maxtor merges with Seagate, it should be interesting to watch what happens as Maxtor's above average warranty claims rates meet up with Seagate's industry average claims rates. Perhaps they'll shed some light on how two companies manufacturing such similar products can have such dissimilar claims rates.
Steady Telecom Warranty Rates
The telecom equipment manufacturer list is actually rather lengthy and rather diverse. Its 124 members make everything from Motorola's mobile phones to Cisco's Internet routers and the navigational equipment of Garmin Ltd. It includes both voice and data communications equipment, as well as professional broadcasting, microwave, satellite, and cable television gear.
Perhaps because there are so many manufacturers in the category, or perhaps because most of their products are sold to carriers and professionals, this group has turned in the most consistent track record of all. As a group, telecom equipment manufacturers have never paid out more than 1.8% nor less than 1.4% of their product revenue to satisfy warranty claims against them. Claims for the group hit $1.9 billion last year, up 15% from 2004 (but steady as a percentage of revenue, thanks to rising sales).
Figure 3
Telecom Equipment Warranty Claims
In % of Sales and $ mil per Quarter
2003 to 2005
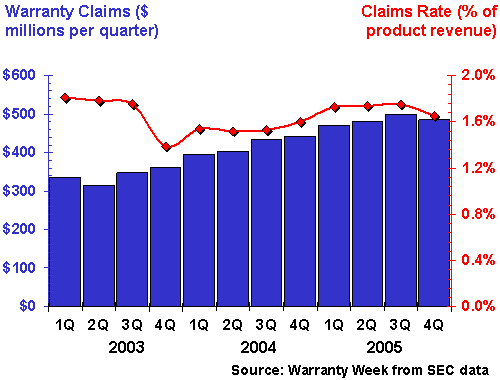
One reason for this seeming stability is the fact that the market leaders, which include well-known brand names such as Motorola, Cisco, Nortel, and Lucent, are each themselves reporting claims rates within or very close to the overall industry average. Only when you go deeper into the list do you find companies much higher (3Com, at 4.2%) or much lower (Scientific Atlanta, at 1.3%) than average. Perhaps at some future point we'll chop this category into smaller subcategories to see whether different product lines have different warranty signatures.
Equipment vs. Parts
The category of semiconductors and printed circuit boards has its own peculiarities. Though the claims rate curve for its 98 members remains within a rather predictable 0.8% to 1.4% range, none of the top ten warranty providers falls within it. On the high side, you have Novellus Systems, Credence Systems, and Coherent Inc., reporting warranty claims rates of 3.1% to 6.3%. On the low side, Honeywell International and Advanced Micro Devices are at 0.5% to 0.7%.
Overall, it seems as if the makers of the actual electronic parts have low claims rates, while the makers of the manufacturing equipment and tools have much higher rates. In other words, Novellus has a 6.3% claims rate while AMD has a claims rate 13 times lower. So while it may be true that electronic parts suppliers have low claims rates, for the most part their suppliers have unusually high claims rates. It's as if the production machinery absorbs all the warranty cost so the products can be made defect-free.
Figure 4
Semiconductor & Printed Circuit Board Warranty Claims
In % of Sales and $ mil per Quarter
2003 to 2005
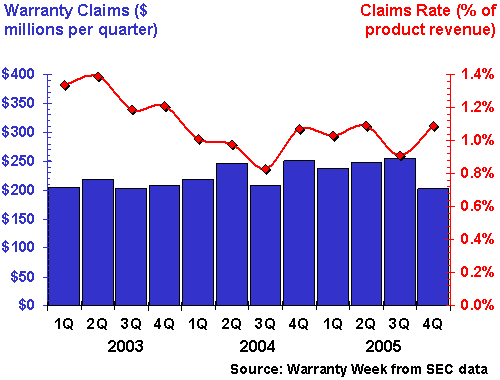
In the automotive warranty chain, the big surprise is that companies who make aftermarket replacement parts such as Midas Inc. and Standard Motor Products reported the highest claims rates -- higher than even the OEMs. In the computer industry, the surprise is that the highest claims rates come at the other end of the warranty chain, amongst the makers of the production equipment.
Peripheral Warranties
The peripherals category basically includes everything not in one of the categories above. It includes the imaging equipment of Eastman Kodak, the scanners of Xerox, the printers of Lexmark, and the bar code readers of NCR and Symbol Technologies. And perhaps because of this diversity of product lines, it is the most volatile category of all. Claims rates have doubled over the past 18 months, going from 0.7% in mid-2004 to 1.4% at the end of 2005. However, that has more to do with fluctuations in sales, because as the blue bars in Figure 5 illustrate, claims have not gone above $250 million per quarter nor below $200 million per quarter.
Because of the vast product mix, there are no real trends in this category. The diverse product lines of Tyco International have an overall claims rate of only 0.3%, while the printer-heavy product line of Lexmark ended 2005 with a 9.6% claims rate. The latter situation is caused by the heavy initial discounting seen with printer hardware, combined with the lucrative aftermarket for printer ribbons, toner cartridges, and other consumables. Since we don't count revenue derived from sales of consumables (which account for 66% of Lexmark's total revenue), the warranty claims rate works out to an unusually high number. Normally, a claims rate above 5% is a sign of trouble, but in the case of printers, it's normal.
Figure 5
Computer Peripherals Warranty Claims
In % of Sales and $ mil per Quarter
2003 to 2005
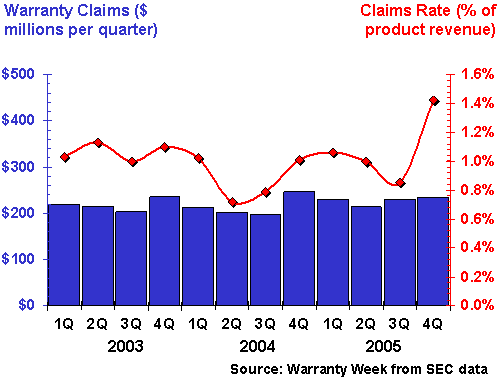
The 60 manufacturers who make up the peripherals category together reported $908 million in warranty claims last year, up just under 6% from 2004 levels. Claims rates turned upwards at year's end because, frankly, some of the manufacturers of high-claims-rate printers and copiers saw their sales increase faster than some of the low-rate companies. And some of the low-claims-rate companies such as Tyco have actually seen their payments shrink: from $134 million in 2004 to $119 million in 2005.
Medical & Scientific Equipment
The five lists of manufacturers detailed above showed quite a bit of overlap with one of the two other electronics-heavy product categories: medical and scientific equipment, and consumer electronics. In fact, of the 74 consumer electronics manufacturers we follow, fully 59 were also on one of the five lists detailed above. And of the 15 who weren't crossovers, only two were of any appreciable size.
However, the list itself is a bit misleading, because it includes only U.S.-based manufacturers of consumer electronics items. And since there are no American companies manufacturing televisions or radios (even the GE and RCA brand names are licensed to non-American companies), all that's left on the Made in the U.S.A. list are digital music players, digital cameras, and other computer-like handheld products. So we scratched the list of consumer electronics manufacturers. We did decide, however, to include the medical and scientific list here, because only 30 of the 135 companies on that list were also on another list. For instance, Eastman Kodak makes computer peripherals as well as medical imaging systems. Agilent Technologies and Tektronix make both scientific tools and computer test equipment. Coherent Inc. makes lasers with applications in multiple industries, including semiconductors, consumer audio, and medical equipment. The overall trend in medical and scientific equipment warranties is up. Claims were up 14% last year to $783 million. The claims rate was also up, hitting a new three-year high of 1.1% during the second half of 2005.Figure 6
Medical & Scientific Equipment Warranty Claims
In % of Sales and $ mil per Quarter
2003 to 2005
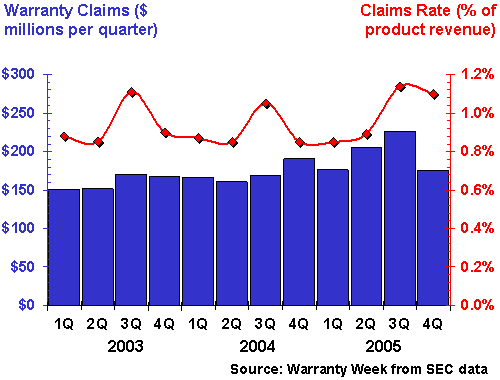
In the grand scheme of things, however, 1.1% isn't really that high. It means that a medium-sized warranty provider such as RadiSys Corp. pays out $2.8 million in claims on sales of $260 million. Semiconductor test equipment maker Cohu Inc. paid out three times as much on just about the same amount of sales. In different industry segments, normal means different things. Let's take these six categories and put them all on the same chart. Though some of these categories are too broad to provide anything approaching a "signature" warranty claims rate for a given product type, others such as computer OEMs and data storage devices do exactly that. As is seen in Figure 7, computer OEMs have the highest claims rates of all, while data storage devices are down a notch. They are followed by telecom equipment, and then by an intertwined grouping of the final three.
Figure 7
Computer & Electronics Warranty Claims
In % of Sales per Quarter
2003 to 2005
For comparison's sake, please take a look at Figure 4 in the April 25 newsletter. It appears as if there is a similar relationship between the OEMs of the computer and automotive industries and their respective suppliers. And in both cases, the OEMs are at the top of the chart while the parts and component suppliers are towards the bottom.
| Back to Part Two | Go to Part Four |


