

Warranty Stability:
Whether a company pays a little or a lot for warranty claims, the stability of the reserve fund should be preserved. But out of the top 100 warranty providers, only 24 seem to be doing it well, as measured by changes in some key ratios over time.
One could view the warranty equation like a savings account in a bank. The accruals are deposits; the claims are withdrawals; and the warranty reserve is the balance in the account. If deposits exceed withdrawals, the balance will grow. But if the amount of warranty claims exceeds accruals, the size of the reserve will shrink.
Large companies typically have huge warranty reserves. At the end of June, General Motors had $8.85 billion in its warranty reserve. That's nearly 25% of all the reserves kept by all U.S.-based manufacturers, but it's actually significantly less than GM kept in its reserve last year. In fact, GM has taken more out of its reserve fund in the past year than all but 10 companies ever had in their reserve fund.
Compared Against Themselves
At the other extreme are companies such as Mechanical Technology Inc., which ended June with only $26,000 in its reserve fund. GM would go through that amount in under a minute. So how can companies so different in size be compared to one another? It simply doesn't work. Any comparison that includes either GM, Ford, Dell or HP is going to be so heavily weighted by them that it will simply reflect their data. But take their data out of the equation, and you're missing nearly half of all the warranty spending.
So what we're going to do instead is compare each company against itself over time, and then compare the results. For instance, so far this year GM has been paying out claims at a rate of $366 million a month. So that $8.85 billion is equivalent to 25 months' worth of claims. Mechanical Technology is paying claims at a rate of $667 a month. So its reserves are equivalent to 39 months' worth of claims. Therefore, even though the companies are vastly different in size, one could safely say that Mechanical Technology keeps a thicker cushion in its warranty reserve than GM, given what each company is currently experiencing in claims paid per month.
In the charts below, we're comparing two key ratios: reserves divided by claims, and accruals divided by product sales. For GM, the ratio between reserves and claims has remained within a tight range of 22 to 25 months for the past 14 quarters. The ratio between accruals and sales has ranged from 0.027 to 0.037 over the same period, which means that GM has varied the percentage of sales it puts away as warranty accruals between 2.7% and 3.7%.
That might sound like a wide spread, but in GM's case it's happening for all the right reasons. The amount the automaker spends on warranty claims per vehicle has been falling, and therefore the company is putting less aside than it used to. But as demonstrated by the stability of the ratio between reserves and claims, GM is being careful not to put too little aside, given what it expects to pay out over the life of its warranties.
We're going to dive a little deeper and compare the stability of not only GM's warranty reserves, but also the reserves of all the other major warranty providers. Specifically, we're going to examine the books of the top 100 warranty providers, and see which are the most stable when it comes to the ratio between their warranty reserve balance and their monthly claims outlay.
Best in Class
It turns out that roughly 24 companies are very stable when it comes to the reserve-claims ratio, while about 20 are extremely unstable, and the rest are somewhere in between. But what is stable? Perhaps it would help if we start with an example of four companies that are extremely inconsistent. As the saying goes, a picture's worth a thousand words.
Figure 1
Warranty Reserves vs. Accruals, 2003-2006
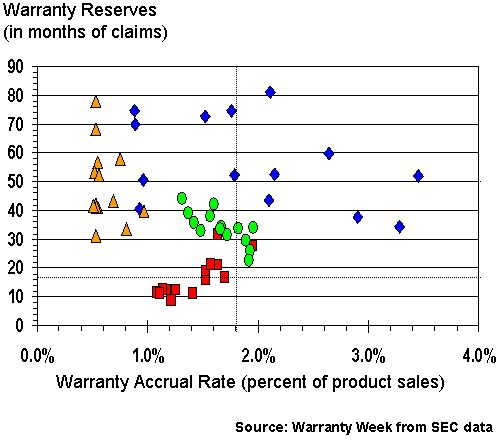
In Figure 1, we see four companies, each represented by a different color and shape. We won't use names, because our intent isn't to embarrass their chief financial officers or alarm their shareholders. But it's probable that the CFO of the Blue Co. is throwing darts when it comes time to decide how much to accrue for warranty each quarter. Sometimes he puts aside more than 3% of sales. Other times he puts away less than 1%. His warranty reserve balance gyrates as a result, soaring to 81 times monthly claims and plunging to 34 times monthly claims.
The Orange Co. CFO, meanwhile, is basically putting aside half a percent of sales as accruals no matter how high or how low actual claims are. This stubborn behavior directly contradicts what he says he does in his annual report. He tells his shareholders that he sets aside enough at the time a product is sold to fund future claims. And he says he adjusts this amount periodically to account for deviations from what he expected at the time of sale. But if he was really doing that, his reserves wouldn't be rising and falling so much. Good thing his shareholders don't know what he's doing.
The Red Co. and Green Co. accounting departments are doing a better job managing accruals, but what they're not doing is recognizing that their claims rates aren't changing at the same rate as accruals, or in the same direction. So what happens is that they move in a diagonal pattern as they vary their accrual rates between 1% and 2% of sales. If they cut accruals and the claims rate doesn't fall, the thickness of the reserve fund's cushion shrinks, and the ratio between claims and balance falls. If they raise accruals and the claims rate doesn't also rise, the reserve fund inflates to a higher ratio. They end up having put more aside than they really need, given what they can reasonably expect in claims.
24 Well-Managed Companies
A well-managed company would move in a straight line from left to right, with little or no movement up or down. A well-managed company that issues primarily one-year warranties would move in a straight line at the 12 mark on the vertical axis. A well-managed company that issues primarily three-year warranties would move in a straight line at the 36 mark. And if a well-managed company suddenly changed its warranty coverage from one year to three, or from three years to five, we would expect to find a sudden jump in both ratios, as the company adapted to the new conditions.
Of the 24 well-managed companies that we found, 12 were more or less keeping accruals constant, while the other 12 were varying accruals in a way that kept the ratio between claims and reserves more or less constant. Of the 12 that were varying accruals, four were doing so because claims were increasing, five were doing so because claims were decreasing, and three were seeing no clear up or down trend for claims.
To make the data more readable, we broke those 24 companies into six groups of four. We could have done four groups of six or even two groups of 12 instead, or perhaps 24 single-company charts. It was just a question of readability. In other words, there's no special reason why any particular company is in any particular group. It's not as if those in Figure 2 are the best and those in Figure 7 are the worst (they're in Figure 1). In fact, we chose members of different industries with different product lines precisely because they were each experiencing warranty at different rates, and therefore their data wouldn't overlap too much.
Let's start with the 12 that have managed to keep both the reserve-to-claims ratio and the accruals-to-sales ratios in a narrow range over the past two-and-a-half years. Like sharpshooters, they've placed 14 shots over the past two-and-a-half years in a tight cluster, as is perhaps best illustrated by the Ford Motor Co., in red in Figure 2 below, or by Pulte Homes Inc. in Figure 3 below.
Figure 2
Warranty Reserves vs. Accruals, 2003-2006
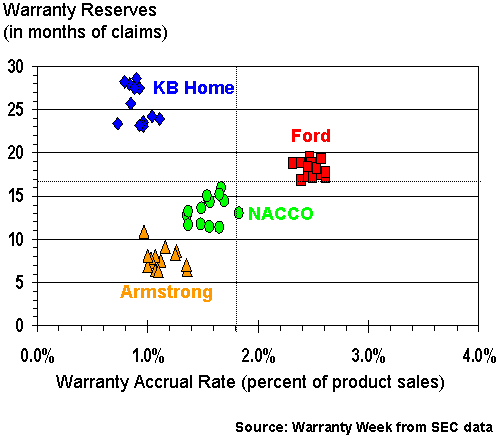
The grid lines, by the way, are the medians for the 800 product warranty-issuing companies tracked by Warranty Week since 2003. The median accrual rate is 1.8% of product sales, and the median reserve-to-claims ratio is about 17 months. Both have remained fairly constant over time.
As is depicted in Figure 2, NACCO Industries has remained very close to these median figures over time, which implies that the average period of all the product warranties it issues -- for everything from forklifts to toasters -- is close to 17 months. KB Home, in contrast, is clustered closer to two years, while Armstrong Holdings Inc. is closer to one year. If these aren't the average warranty periods of their respective product lines, one would have to wonder why they're sticking so closely to these reserve levels.
In Figure 3, Pulte Homes is in another tight cluster, showing that the relationship between accruals, claims, and reserves has shown little change over the past 14 quarters. That doesn't mean they're unchanged. It simply means that as one changes, the others change in lockstep. It's been Pulte's goal to have enough in its warranty reserve to pay between seven and 10 months of claims, no matter what the actual dollar amount might be.
Processing Recent Good News
By the way, the data in these charts is for the 14 quarters from the start of 2003 through June of 2006. Therefore, it doesn't yet reflect the good news that Textron reported two weeks ago -- that its Cessna unit's profits were up thanks in part to lower warranty costs. It will be interesting to see how the company processes this change in its third quarter warranty accounting. Will it recognize the decrease in spending by allowing its reserves to shrink? Or will it keep the balance constant and allow the ratio between reserves and claims to grow? Perhaps the best test of the relatively static companies in Figures 2 to 4 is what happens when something changes radically?
Figure 3
Warranty Reserves vs. Accruals, 2003-2006
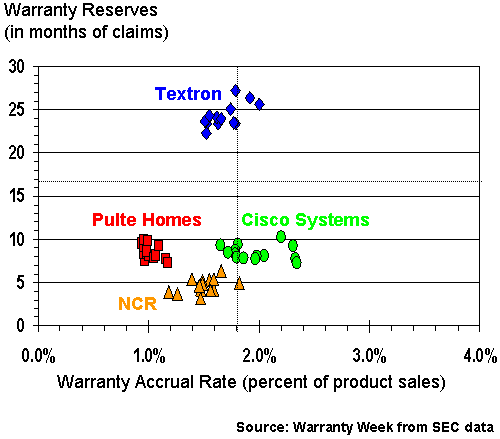
In Figure 4, the scale has been widened slightly to allow room on the right for Sun Microsystems and Hewlett-Packard. Though both accrue warranty funds at a slightly higher rate than most of their peers, they are each adept at making sure that the ratio between warranty reserves and claims remains more or less the same. While they might pay more claims, they also manage it better.
Notice that Sun isn't in as tight a cluster as some of the others. But also notice that the pattern is more or less horizontal. What this means is that as the claims rate changes, accruals are quickly modified in a way that keeps the reserves-claims ratio at a more or less constant eight or nine months. The flatter the pattern, the more likely it is that the company is monitoring and detecting changes in its claims rate, and is doing something about them. And in Sun's case, the recent trend has been towards lower claims rates (4.2% at midyear), lower accrual rates, and smaller reserve fund balances.
Figure 4
Warranty Reserves vs. Accruals, 2003-2006
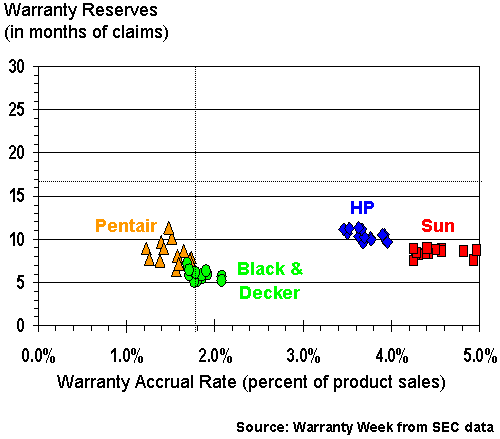
Pentair, we should note, has lately suffered the ire of investors and stock analysts after increasing the warranty reserve levels in its pool and spa business. The irony is that until now, it had one of the best records in the warranty management business, as evidenced by the tight cluster of orange triangles in Figure 4. It's also been at or below the medians for the past 14 quarters. But investors don't care much about the past. All they want to know is how was the latest quarter?
Figures 5 through 7 detail the key ratios of 12 more companies, which show the same horizontal pattern as does Sun, but over a wider area. While Sun has seen its accrual rate vary from 4.7% to 5.4% since 2003, some of these companies have covered a lot more ground. But again, the flatter the horizontal pattern, the sharper the company has followed the changing ratios between claims, accruals, reserves, and sales.
We added one more metric to the next three charts. The colored arrow next to each company name signifies whether claims are increasing, decreasing, or remaining more or less the same. This is important because the 14 points aren't labeled in a time series, so it would otherwise be difficult to tell why the accrual rate is changing. So for instance, in Figure 5 the claims rates of Apple Computer and Fleetwood Enterprises have recently been trending upwards, while the claims rates for General Motors and Thor Industries have been trending downwards.
Figure 5
Warranty Reserves vs. Accruals, 2003-2006
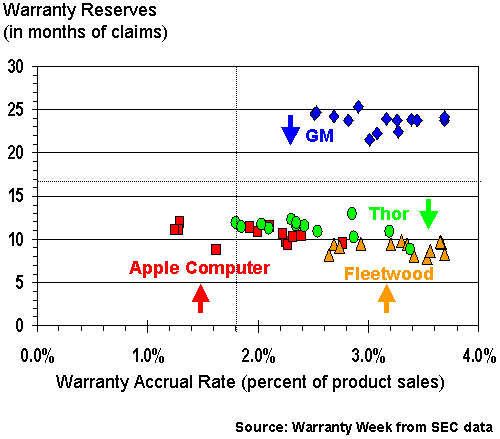
The point is, whether the claims rate is going up or down, a company should always have enough funds on hand to pay the warranty expenses it can reasonably expect in the future. So if the average warranty is 12 months long, and if claims total $1 million a month, the warranty reserve should contain $12 million. If claims surge to $2 million a month, that reserve is going to last only six more months, unless the balance is somehow increased to $24 million. If claims come back down to $1 million a month after a short spike, there's no longer a need to keep such a large reserve, and some money needs to be removed.
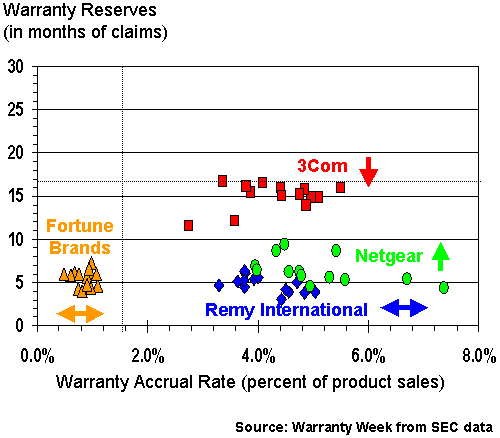
We had to widen the scale in Figures 6 and 7 a bit to display accrual rates up to 8%, because at times companies such as Netgear Inc. and Standard Motor Products Inc. have come close to those levels. For Netgear, that's because claims have surged in 2006 above 6% of revenue for the first time. But for Standard Motor Products, both its highest and lowest accrual rates actually occurred in mid-2004. Since that time, the trend has been both up and down, with no clear direction so far. That's why we placed a double-tipped arrow next to its name.
Figure 6
Warranty Reserves vs. Accruals, 2003-2006
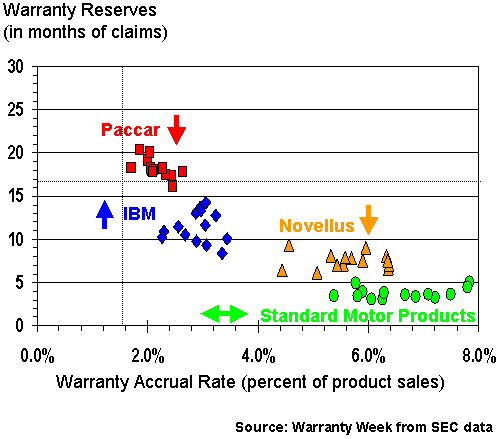
For Novellus Systems and Paccar Inc., the trend for claims has lately been down. Novellus saw its claims rate peak at 6.7% four quarters ago. It's now below 4.9%, and accruals have been adjusted accordingly. For Paccar, the peak claims rate of 2.5% came in 2003. It's been trending slowly downwards for nine consecutive quarters now, and as the red squares in Figure 7 illustrate, the company has modified its accruals to parallel this decline.
For IBM, the recent trend in claims rates has been upwards, and because of the spin-off of the PC operations to Lenovo, there has also been a radical change in the product mix. There also has been a noticeable divergence between the company's claims rate and its accrual rate for the past year, but a steady flow of upwards changes in estimate (additional one-time accruals) has made up for the shortfall, and has kept the ratio between reserves and claims close to 10 or 11 months. The dips below 10 months actually all occurred in 2003.
Figure 7
Warranty Reserves vs. Accruals, 2003-2006
Believe it or not, these are the flattest 24 patterns in the list of the top 100 warranty providers. While the dispersal of the other 72 companies aren't as extreme as the four unnamed companies depicted in Figure 1, what they illustrate is that not every company which asserts that they adjust their accruals and reserves in response to changes in claims rates actually does so. Good thing nobody's paying attention.
In two weeks, the last in a series of four Webcasts sponsored by SAS Institute and Warranty Week, and produced by Better Management, will address the topic of "rightsizing your accruals." While the Webcast is free, pre-registration is required. Your editor will be bringing some of this data to the broadcast, and your questions and comments are welcome.