

Warranty Claims vs. Accruals:
Using a few key warranty metrics, it's becoming easier to tell when a given company is managing its claims and accruals responsibly. It's also becoming easier to tell when things run off the rails, even if a company makes no specific disclosures of a crisis.
Because all companies that maintain a warranty reserve fund are now required to report quarterly upon changes in the size of that fund, it's becoming possible to chart some key warranty metrics that were previously kept as closely-held secrets.
Companies don't generally announce that they've detected a sudden drop in product quality or that they expect a sudden surge in defects. But if one knows what's normal for a given company, it's becoming a rather straightforward process for outsiders to detect these kinds of changes, as reflected in a few key warranty metrics.
First is the claims rate, the ratio between claims paid and money made. If a company pays out $1 million in claims and brings in $50 million in revenue, its claims rate is 2%. It's the same for the accrual rate, except this metric reflects the amount of money put aside now to fund future warranty claims.
It also is the best evidence of what a company believes will happen. If a company is putting aside 2% of its revenue and is spending 2% of its revenue, then it is serving notice that it expects to be repairing defects at more or less the same rate as it is now. But if it suddenly cuts accruals to only 1% of revenue or doubles them to 4% of revenue, it is indirectly announcing that there's been a change in quality levels, and it expects to need either more or less warranty funds in the future as a result.
Measuring Capacity
Meanwhile, one can also compute the ratio between what a company pays in claims and how much it keeps in its reserve fund. If a company currently pays out $1 million per month in claims and keeps a balance of $15 million in its warranty reserve fund, then one could say that the capacity of such a fund would be 15 months. For a company selling products that carry one-year warranties, this level would be more than adequate. But for a company with five or 10-year warranties, this level of reserves might not provide enough of a cushion to get a company through the inevitable rough patches.
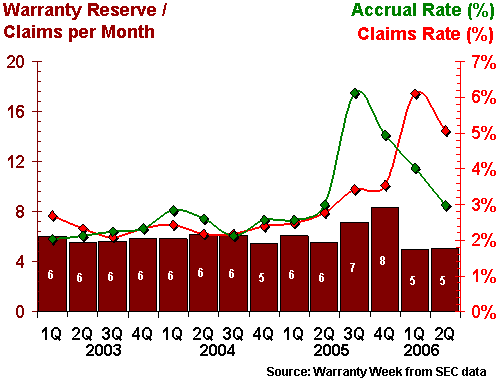
Let's start with an example of a company that's content to live with an extremely thin cushion in its warranty reserve. Applica Inc., makers of kitchen and personal appliances, has barely 60 days' worth of funds on hand to pay claims, and is paying out between 6% and 10% of its sales revenue in warranty claims. The median for all companies is 17 months and 1.8%, so its cushion is decidedly thinner than most and its claims rate is decidedly higher than most.
Figure 1
Applica Inc.
Warranty Claims vs. Accruals, 2003-2006
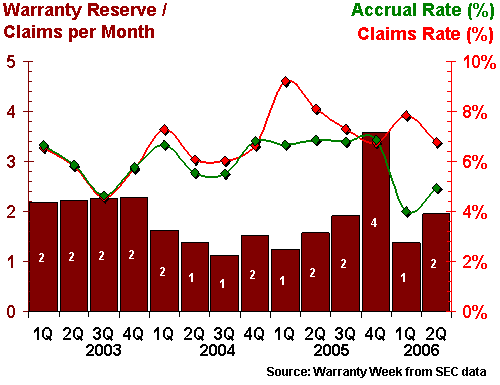
As of June 2006, Applica had $3.9 million in its warranty reserve, at a time when it was paying claims at a rate of just under $2 million a month. This means the ratio between reserves and claims is just under two months. At that same moment, Jarden Corp., makers of Sunbeam, Coleman, First Alert, and other appliance brands, was paying out $9.5 million a month in claims and had $72 million in its reserve, for a ratio of 7.6 months, or about 230 days. Helen of Troy Ltd., another competitor in the small appliance sector, was keeping a 104-day supply of funds in its warranty reserve. So even among close competitors, 60 days is a thin cushion.
The Thicker the Cushion
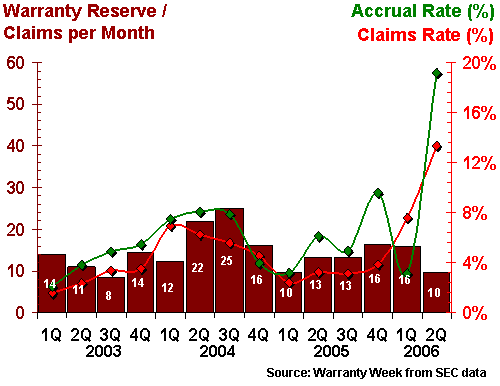
At the other extreme is Midas Inc., the replacement muffler company. It typically keeps four to five years' worth of funds in its warranty reserve, which is not surprising given its lifetime warranty policy. The company believes this policy is a competitive advantage, but as the data in Figure 2 illustrates, it comes with a cost. Most quarters, Midas is paying out anywhere between 8% and 16% of its product revenue in warranty claims.
Figure 2
Midas Inc.
Warranty Claims vs. Accruals, 2003-2006
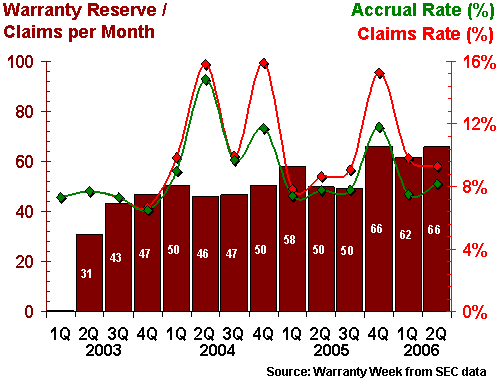
Midas didn't even maintain a warranty reserve until early 2003, preferring to expense claims immediately as they arrived. But then it changed its distribution model, relying on AutoZone Inc. in the U.S., and Uni-Select Inc. in Canada, so it made a $33.3 million special accrual in the second quarter of 2003.
Much of the company's revenue comes from sources such as royalties, franchise fees, and real estate sales and rentals. So although it reported $192.5 million in total revenue last year, only $51.7 million of that came from replacement part sales. At the same time, warranty claims totaled $7.9 million for the year, giving the company a claims rate of 15%. Warranty reserves, which were as high as $39 million in early 2005, have fallen to around the $35 million level this year.
Accruals Exceed Claims
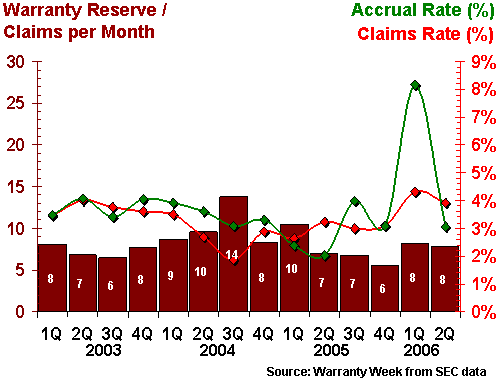
Figure 3 is an example of a company that almost always accrues more than it pays out in claims. Never mind that it's Lexmark International, or that the company's claims rate hovers close to 9%. It's a printer company, and printer companies typically sell their warranted hardware at low prices and make the bulk of their revenue (and profits) on sales of ink, paper, and other (non-warranted) supplies. What's interesting about this chart is how the green line is always above the red line.
Figure 3
Lexmark International Inc.
Warranty Claims vs. Accruals, 2003-2006
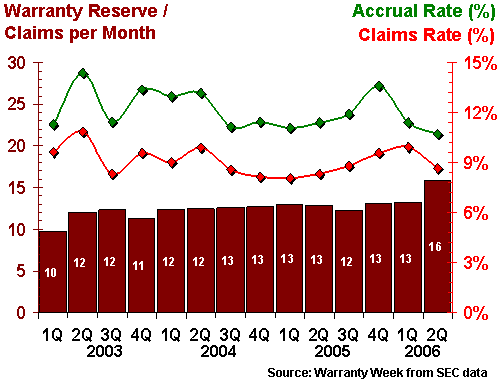
If this were a checking account, deposits would always exceed withdrawals, and the balance would be growing. But as is evident from the brown bars beneath the lines, the ratio between claims and reserves has remained close to the 12 or 13 month level for most of the past three-and-a-half years. So if claims aren't consuming the extra deposits, and if the balance isn't growing, then where is the money going?
The answer is that Lexmark is removing funds through changes of estimate, which don't appear in this chart. For instance, in the first quarter of 2006 it made normal accruals $50.2 million and then made a downward change of estimate of $8.8 million. Actual claims totaled $43.7 million, so the reserve actually contracted from $195 million to $193 million. During all of 2005 Lexmark accrued $245 million and removed $54.4 million through a change of estimate, while paying $172 million in claims. So the warranty reserve grew by $18 million over the course of the year.
Claims Exceed Accruals
It's quite the opposite case at Electro Scientific Industries, makers of semiconductor inspection and printed circuit board test equipment. As depicted in Figure 4, the company has for more than two years been paying out a significantly larger amount in claims than it was setting aside in warranty accruals. In addition, as is typical of many companies in the semiconductor industry, it was maintaining a relatively thin cushion in its warranty reserve -- four or five months' worth at best.
Figure 4
Electro Scientific Industries Inc.
Warranty Claims vs. Accruals, 2003-2006
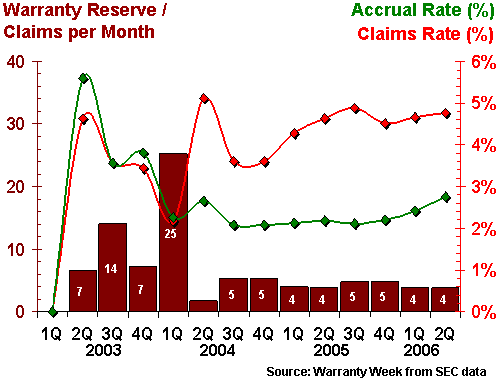
Fortunately, in fiscal 2004 it added $6.3 million through a special change of estimate, followed by $4.6 million more in fiscal 2005 and $4.3 million more in fiscal 2006. One could look at Figure 4 and wonder why the company doesn't simply raise accruals to 4% or 5%, eliminating the need for periodic changes of estimate. In other words, why not change the estimate permanently, so that regular accruals were sufficient?
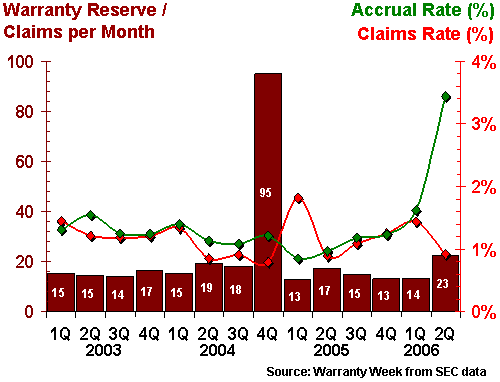
Figure 5 is quite unremarkable except for the obvious spikes in late 2005 and early 2006. Evidently, the warranty managers at Coachmen Industries saw an upward trend coming, so they raised their accrual rates exactly six months before the claims came in. Now that the wave seems to have crested, accruals are returning to their baseline rate.
Figure 5
Coachmen Industries Inc.
Warranty Claims vs. Accruals, 2003-2006
In contrast, the crisis is just beginning at Hydrogenics, makers of hydrogen fuel cells. Sales are steady at $6 to $9 million per quarter, but claims recently exceeded $1 million per quarter for the first time, a level almost four times that seen a year ago. So the company's claims rate has soared from 3.2% to 13%, and while claims are also on the upswing, the ratio between reserves and claims is falling.
Figure 6
Hydrogenics Corp.
Warranty Claims vs. Accruals, 2003-2006
Meanwhile, at semiconductor test equipment company Cohu Inc., the crisis seems to have gone elsewhere. For most of three years, the company's claims and accrual rates remained in a range of 3% to 4%, except for a short dip in early 2004. Then, in early 2006, the claims rate jumped to 4.3% and the accrual rate soared to 8.2%.
Figure 7
Cohu Inc.
Warranty Claims vs. Accruals, 2003-2006
The company attributed the change to "higher than expected costs associated with supporting certain customer test handler applications and a more conservative estimate of future handler support costs." But, as is suggested in Figure 7, by the second quarter the accrual rate had returned to the 3% level, and the crisis had seemingly passed.
A Runaway Success?
Speaking of crises, last year we spotlighted TurboChef Technologies and the problems they were having with the commercial ovens installed at Subway sandwich shops. The heated sandwiches caught on so fast at the chain that all the franchisees wanted to install the ovens in 2004. Then, in 2005, the ovens were used so heavily that they inevitably began to require repairs under warranty. And since many of the ovens being fixed for free in 2005 were bought in 2004, there was not much new sales revenue coming in to cover claims.
The result is charted in Figure 8. Warranty reserves, which were kept at a relatively high level in 2003 and 2004, were virtually exhausted by 2005. Claims shot up to just under 48% of revenue by the fall of that year. But here's the good news: claims were most recently measured at 9.3% of revenue, and were back below the $1 million-per-quarter level for the first time since 2004.
Figure 8
TurboChef Technologies Inc.
Warranty Claims vs. Accruals, 2003-2006
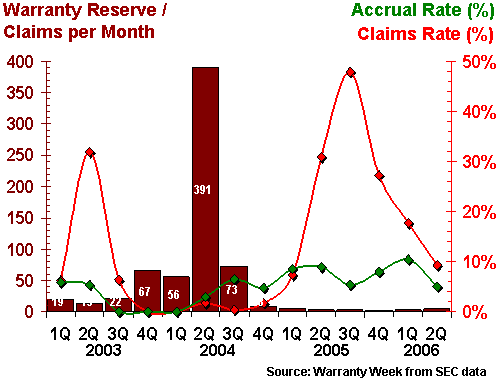
By the way, the 391 level seen for the reserves-to-claims ratio in the second quarter of 2004 was something of a statistical aberration in the opposite direction. The company reported only $7,000 in claims that quarter, and was keeping a reserve of $912,000 on hand. And so, its reserves exceeded claims by a factor of 391 to 1. By the third quarter, claims grew 16-fold and the reserve tripled in size, so the reserve-to-claims ratio dropped to a more normal 73 months. Most recently, however, the ratio stood at only 4.4 months.
Finally, we spotlight another spike in the reserve-to-claims ration, this one at electric motor manufacturer Franklin Electric Company. Actually, in Figure 9 there are two spikes: one in the reserve-to-claims ratio at the end of 2004, and more recently a spike in the accrual rate to 3.4%.
Figure 9
Franklin Electric Co. Inc.
Warranty Claims vs. Accruals, 2003-2006
Granted, 3.4% is no crisis, but it does represent a big change for a company more accustomed to accrual rates around 1.2% or 1.4%. Most of its products are warranted for a year, so the 14-to-19-month range seen for most of the past three years is more than adequate. And the one-time spike in the reserves-to-claims ratio is nothing but another statistical anomaly caused by a sudden time shifting of claims from one quarter to the next.
All through 2002 and 2003, and during the first three quarters of 2004, Franklin paid out roughly $1 million per quarter in warranty claims. But then in the final quarter of 2004, claims suddenly fell off to $224,000. And by the first quarter of 2005, claims had surged to $1.5 million, or 1.8% of sales. So it's reasonable to suspect that some of what should have been paid in late 2004 was not actually paid until early 2005.
Warranty Management in Practice
We could go on, but these nine examples provide a good summary of the situation. While most companies try to keep their claims and accrual rates close together and their reserve balances stable, occasionally something comes along that forces them to change their estimates. Sometimes it takes a bit of management and forecasting skill to decide when to raise the accrual rate and when to drop it back down to the baseline.
For years, companies did this in private. Now, thanks to the warranty disclosures they must make in their financial statements and a little extra math, it's possible to chart these ups and downs like any other financial metric. We'd suggest that the ratios between claims and sales, accruals and sales, and claims and reserves over time can provide a fast snapshot of how well a particular company is managing their warranty operations.
Next Tuesday morning, the fourth and last in a series of Webcasts sponsored by SAS Institute and Warranty Week, and produced by Better Management, will address the topic of "rightsizing your accruals," using some of this data as examples. While the Webcast is free, pre-registration is required. Click here for details.
Benchmarking to Shape a Best-in-Class
Warranty Management Solution
Warranty Week has teamed up with APQC, a nonprofit benchmarking and research organization, to collect data on service after sales current practices and performance, specifically:
- interacting with customers
- managing product returns
- performing product service
- managing service repair parts
- pursuing value-adding service offerings
- recovering value through product refurbishment
How Does Your Company Rank?
Benchmark your service after sales processes against industry peers and top performers. Participate in this confidential benchmarking study at no cost to your organization. The research is sponsored by IBM.
Benchmark your organization now! Go to: www.apqc.org/warrantyweeksurvey