

is the latest in a series of contributed editorial columns. Readers who
are interested in authoring future contributed columns can click here
to see the Guidelines for Editorial Submissions page.
Warranty Financial Management:
Part 2: Optimizing Warranty Reserves. Rightsizing a $100 billion dollar worldwide warranty reserve by turning lazy capital into working capital.
By Greg Spraker, SAS Institute Inc.
Warranty Financial Management (WFM) is comprised of a complicated set of interactions both inside of a corporation's disparate operations (finance, manufacturing, service/warranty, sales) as well as outside, with the Sarbanes-Oxley Act adding compliance burdens. The complications with disparate operations and compliance programs are exacerbated by confusion over process ownership, complex warranty policies and the reality of manual business processes.
Although WFM can be very complex, details provide insight and guidance to the customer experience and act as a pathfinder to profitability. The magnitude of the problem is so large, that even small improvements in WFM performance can generate substantial shareholder value.
The first article in this series defined warranty expense management (Warranty Week, Sept. 12, 2006). In that article, we talked at length about the foundations of WFM. This included reasons why WFM is getting so much attention, what is included in a standard definition for warranty, and finally some suggestions for typical components of warranty cost.
Today's article will build upon the first article by discussing the topic of warranty reserves: their size, uniqueness and business problems. We will walk through three best practices for optimizing warranty reserves with automation, accuracy, and clarity.
Some of these topics were also explored during a Nov. 14 Webinar entitled "Rightsizing Your Accruals: Transforming Lazy Capital into Working Capital." Readers can view an archival copy of the Webcast by going to http://www.bettermanagement.com/seminars/default.aspx on the Better Management Web site.
The Value of Best Practices
Prominent companies understand that in order to survive and thrive, they must link every customer experience data source, task and activity back into the organization. The faster the customer experience loop gets closed, the quicker an image of marketplace reality can be converted into opportunities. This "closing the loop" on the customer experience is becoming critical for survival as product commoditization erases the differentiators that are seen in today's products. As commoditization applies downward pressure on the profitability of simply selling a product, organizations are being forced to evolve to service models that allow profit to be collected by developing closer relationships with their customers.
The capabilities discussed in this article will also serve as a foundation for part three in the series, which will consider the business value of optimizing select business processes that empower the selling of service contracts -- not simply a product -- with data automation, forecast accuracy and performance clarity.
Before we discuss the three best practices, let's consider the size, uniqueness and general business issues.
Size:
Today, U.S.-based Corporations maintain more than $39 billion in reserves to cover liability associated with standard warranty policies. Worldwide, warranty related reserves are estimated to be over $100 billion. Surprisingly, most corporations use manual business processes to manage and forecast reserves. Case studies conducted by SAS Institute indicate that there is significant value in driving automation, accuracy and clarity into this manual business process. Globally, the magnitude of opportunity is measured in billions of dollars by transforming "lazy" capital into working capital.
Uniqueness:
One of the key reasons that accounting for warranty "insurance" is unique relative to typical insurance (life, car, home) is that typical insurance tends to rely on standardized tables as well as factors that are outside the provider's direct control. Warranty is a function of factors that manufacturers have control over and can be addressed by altering processes. By altering these processes, product performance can be altered and sensitivity analysis can help prioritize the business impact these changes would have. The opportunity within the complexity is that product performance can be a fast changing, dynamic business problem that can be optimized only with automation, accuracy and clarity.
Business Issues:
If your organization is limited to forecasting warranty exposure only once, upon product shipment, then it is effectively limited to a single snapshot of historical product performance (as seen in the table below). For instance, for a product with a 12-month warranty that historically has demonstrated a failure rate of 2% per year and an average cost per claim of $100, a manual reserve estimate would be $2 per shipped product. This $2 per shipped product would be set upon shipment for the entire lifecycle of product performance. This manual approach may be followed for all products. See an example of the approach below.
| % Failure/Year | Avg. Cost per Claim |
Warranty Period | Total Accrual per Product |
|
| Product A | 2% | $100 | 12 mo. | $2.00 |
| Product B | 1.6% | $200 | 18 mo. | $4.80 |
| Product C | 3% | $400 | 6 mo. | $6.00 |
These manual processes typically limit the focus to monthly shipments. The approach described above is not optimized for numerous reasons:
- What is the accuracy of the forecast? Organizations that are concerned about accuracy use distributions to forecast performance, not discrete percent estimates.
- How many hours does it take to complete the forecast?
- Is there an audit trail for the forecast?
- What happens when an emerging issue appears in one of these products? How does the organization readjust the reserves and by how much?
- How does one account for decreased warranty cost that typically occurs as the manufacturing process matures?
- Is there a way to judge the effectiveness of sensitivities on the overall reserve?
The answer is that with manual processes, it may not be possible to sense the reality of the situation and adjust the reserves. The best practice approach is to leverage technology with integrated business processes to optimize the reserve process. By automating, the approach analyzes product field performance with dynamic forecasting of the entire exposed population. By using the total population as a basis for the forecast, emerging issues and reliability growth will be automatically factored in.
Beyond the difficulty of determining product performance is the ability to do sensitivity analysis around the results that were assembled by manual processes. In addition, sensitivity analysis that allows managerial judgment in setting reserves is often complex and inaccurate with manual processes. If your organization does not understand the process to formulate the results and your forecasts are inaccurate, the organization will not trust the forecast. This lack of understanding and therefore trust often drives conservative forecasting which leaves capital unutilized and contributes to lost productivity and accuracy.
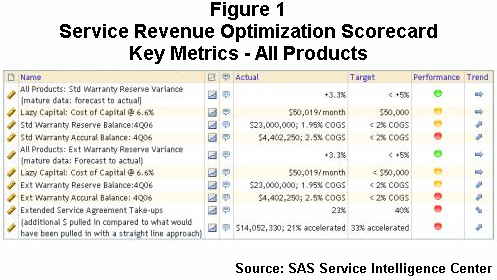
Key Metrics for Standard Warranties
In the dashboard view below, taken from a screenshot of the SAS Service Intelligence Center, the metrics will alert the user that the Reserve Balance is higher than expected for a hypothetical product Alpha. This could indicate there are increasing warranty costs.
How Large Is the Opportunity?
What is the quantitative opportunity for improvement? Depending on the size of the organization and the size of the problem, the potential savings could range from $220,000 per year to above $12.8 million per year. The majority of the savings are delivered from driving additional accuracy. The table below includes some rough estimates of the savings related to the size of a warranty reserve.
| Qualitative Savings | Warranty Cost |
Saving Segmentations | Quantitative Savings | |
| Data Forecasting & Automation | 50% or greater reduction in labor | >$1b >$100m >$10m |
Lazy Business Processes (savings) Up to 8,000 hrs/yr Up to 4,000 hrs/yr Up to 1,000 hrs/yr |
Lazy Business Processes (assume $100/hr) $0.8m per year $0.4m per year $100k per year |
| Forecast Accuracy | Increase accuracy from 20% error to less than 5% error | >$1b >$100m >$10m |
Lazy Capital (assume 20% error rate) >$200m over-reserved >20m over-reserved >$2m over-reserved |
Lazy Capital (8% cost of capital with improvement from 20% error to 5% error) $12m per year $1.2m per year $120k per year |
| Performance Clarity | The cost savings covered under automation. | Possibly the most important component of clarity is the capability to help drive additional revenue by understanding how to price extended service contracts. | ||
| Total Potential Savings | >$1b >$100m >$10m |
Savings Opportunity $12.8m per year $1.6m per year $220k per year |
Data & Forecasting Automation
How much of the process is automated? Manual data modeling can require thousands of hours of labor every quarter. The enormous effort of manually building up a forecast from the product family comes from having to first determine the current claim rate per month of manufacture, and then to forecast the expected liability of the unexposed products. One view of this process is displayed in the exposure chart below:
As mentioned in the September 12 newsletter, the first step is to make sure your organization has a consistent and agreeable definition for warranty cost. Once the organization has an agreeable definition, the next step would be to do an internal assessment to gauge where the organization is relative to an optimized state.
The major contributors to your warranty cost equation are within the direct expenses category and are typically possible to automate. The other areas are may be more difficult and therefore may not be feasible to automate.
Ideally an organization would automate the extraction of those expenses that make up the majority of the organization's definition for warranty cost. While all organizations will eventually have to move to a totally integrated infrastructure, for most this will be an incremental evolution. The initial target should be automating the data extraction of a minimum of 50% with a target of 80% of the contributing warranty expense.
Once forecasting is complete for all products, the next step in a manual process is to reconcile, bottom-up. Without advanced statistical techniques, this typically adds significant error into the forecast - high error rates are amplified by aggregating a large number of product families with a multilevel product hierarchy.
Best in class organizations have this process automated.
The best practice is to allow statistical forecasting to select the correct model, optimize the parameters for that model and add confidence intervals to illustrate the potential variance.
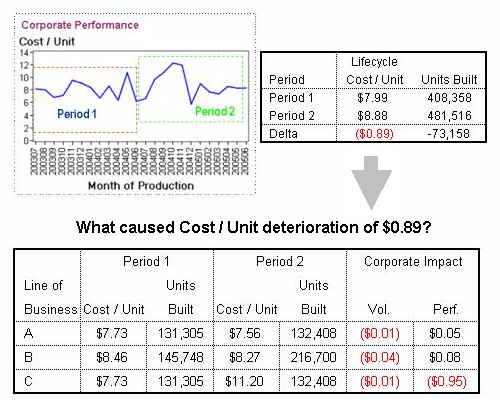
Forecast Accuracy
Manually produced forecasts lack sufficient accuracy. They are also difficult to document and audit. The driving reason is that mature data should be used to measure current accuracy. A technique for determining an organization's reserve accuracy is to compare historical reserves against historical claims. As mentioned above, one must use a mature population (if your maximum warranty period is 18 months from date of shipment, then the maturity threshold is 18 months). Select a one-year time frame of mature population to compare reserves to actuals. In this example, we will pick the 2003 production year.
If your organization's processes are manual, it will be extremely difficult (if not impossible) to censor data associated with different types of policies.
Separate the data into the following line items:
- Claims from products shipped before 2003
- Claims from Products shipped in 2003
- Reserves as of Jan 2003
- Accruals from next 4 Quarters
Warranty Reserves for products shipped in 2003 = Reserves (Jan. 1, 2003) + Accruals (next four quarters: April/July/Sept/Dec) - Claims from products shipped prior to 2003
*certain assumptions necessary
Compare Warranty Reserves for Product shipped in 2003 to Total Warranty Cost for Products shipped in 2003
Performance Clarity
What capabilities does your current organization have for looking at detailed forecasts and performing sensitivity analysis?
Clarity may be most valuable for providing the detailed look (and sensitivities) around product performance. Specifically, leveraging this high clarity of product performance provides a foundation for future profitable services. The typical organization also has several options for support contracts. One of the major capabilities to add to this foundation would be revenue recognition -- using a matching principle (costs distribution matching to revenue distribution) for organizations that sell multi-year service contracts to accelerate the recognition of deferred service contract revenue.
Conclusion
Implementing data automation and forecast accuracy are the keys to rightsizing your warranty reserves and putting that "lazy" capital back to work. The savings from these add up fast. Depending on the size of the organization and the size of the problem, the Potential Savings could range from $220K per year to above $12.8M per year. Furthermore, performance clarity creates the opportunity for new revenue streams via service contracts/extended warranties as well as optimizing your revenue recognition process. In Part 3 of this series of articles, we will dive deeper into the complexities of revenue recognition and the revenue opportunity associated with offering service contracts.
The transition has already begun. The speed of this transformation is a function of an organization's adoption and implementation of these best practices. This mix of technology and business process integration will drive measurable benefits into the organization.
Credits: The content of this article was developed in conjunction with members of the Warranty Benchmarking Team (part of the Institute of Warranty Chain Management), including Tom Bellinger (IBM), David Froning (SAS), Skip Smith (SAS), Mark Demers (SAS), and Bill Roberts (SAS).
About the Author:
Greg Spraker is an Account Manager at SAS Institute Inc. Greg has over 15 years experience in Reliability Engineering and Warranty Management in Telecommunications, Aerospace, Industrial Controls and Medical Devices. He consults with corporations that are seeking to build and optimize their Service Intelligence Center. He is a Certified Reliability Engineer, a member of the board of directors for the Institute of Warranty Chain Management (www.iWCM.org) and holds Bachelor and Masters degrees in Electrical Engineering. He can be reached at greg.spraker@sas.com.
How Does Your Organization's After-Market Performance Rank?
There is still time to benchmark your organization's service after sales function. Warranty Week and APQC, a nonprofit benchmarking and research organization, are offering you the opportunity to collect data on current service after sales practices and performance by participating in the Open Standards Benchmarking Collaborative (OSBC) research, sponsored by IBM. Due to overwhelming response to this survey, we have extended the date by which you can submit your data and be eligible for exclusive benefits.
Visit www.apqc.org/warrantyweeksurvey to submit your organization's data by Feb. 15 at no cost. In addition to a complimentary report comparing your responses with those of others who have participated, you will receive two of APQC's best-selling publications:
- Inventory Optimization: Balancing the Asset versus Service Tradeoff, a new best-practice report with case studies that retails for $495, and
- By the Numbers: Logistics, a benchmark and measures report that retails for $299.
- interacting with customers,
- managing product returns,
- performing product service,
- managing service repair parts,
- pursuing value-adding service offerings, and
- recovering value through product refurbishment.
A Note About Data Privacy and Confidentiality
This study is an ambitious effort to gather high-quality data on the service after sales function. On behalf of Warranty Week and APQC, we would like to affirm our commitment to keeping all your company and personal information entirely confidential. Only the members of our joint research team will have access to this data, and your information will not be used for any marketing or sales activity.


